Glutamate Dehydrogenase
(All numbering and residues are taken from first PDB file)
![]()
![]()
Bending Residue Dihedral Analysis
Residue
iResidue
i+1Distance of hinge axis to residue i in
(A) Distance of hinge axis to residue i in
(A) Change in
(deg) Change in
(deg) Angle of psi(i) axis to hinge axis
(deg) Angle of psi(i) axis to hinge axis
(deg) Percentage Progress
PHE-16
PHE-17
7.6
6.9
4.0
-2.7
87.6
87.8
-7.2
PHE-17
ASP-18
6.2
6.4
-28.4
24.6
26.6
20.4
20.2
ASP-18
ARG-19
6.7
7.2
-23.5
29.9
63.0
66.2
-4.6
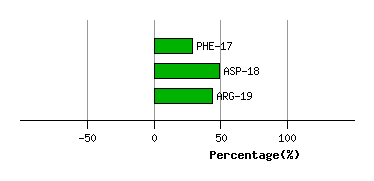
Graph shows rotational transition at bending residues and can be used
to identify hinge bending residues.
Probably only informative for interdomain rotations greater than 20 degrees
Residue
iResidue
i+1Distance of hinge axis to residue i in
(A) Distance of hinge axis to residue i in
(A) Change in
(deg) Change in
(deg) Angle of psi(i) axis to hinge axis
(deg) Angle of psi(i) axis to hinge axis
(deg) Percentage Progress
GLY-206
GLY-207
5.6
5.5
-0.3
0.3
148.6
146.4
11.7
GLY-207
ILE-208
6.3
5.8
4.4
-1.0
89.3
90.1
31.0
ILE-208
HIS-209
5.3
4.3
-19.1
-13.5
96.7
91.9
-21.4
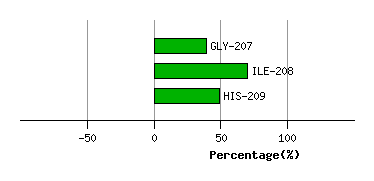
Graph shows rotational transition at bending residues and can be used
to identify hinge bending residues.
Probably only informative for interdomain rotations greater than 20 degrees
Residue
iResidue
i+1Distance of hinge axis to residue i in
(A) Distance of hinge axis to residue i in
(A) Change in
(deg) Change in
(deg) Angle of psi(i) axis to hinge axis
(deg) Angle of psi(i) axis to hinge axis
(deg) Percentage Progress
THR-379
VAL-380
3.0
2.5
-9.3
9.8
174.1
177.5
17.2
VAL-380
SER-381
4.4
3.7
0.3
-0.4
65.9
67.2
-21.7
SER-381
TYR-382
3.9
3.3
4.4
2.5
83.3
85.3
18.6
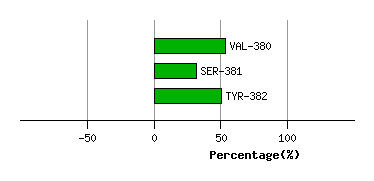
Graph shows rotational transition at bending residues and can be used
to identify hinge bending residues.
Probably only informative for interdomain rotations greater than 20 degrees
Residue
iResidue
i+1Distance of hinge axis to residue i in
(A) Distance of hinge axis to residue i in
(A) Change in
(deg) Change in
(deg) Angle of psi(i) axis to hinge axis
(deg) Angle of psi(i) axis to hinge axis
(deg) Percentage Progress
GLY-452
LEU-453
9.4
9.1
7.6
-6.9
38.2
35.0
-10.9
LEU-453
ALA-454
8.9
8.6
10.9
-15.2
46.8
49.1
-2.1
ALA-454
TYR-455
12.4
12.1
14.7
-10.4
53.0
58.0
17.9
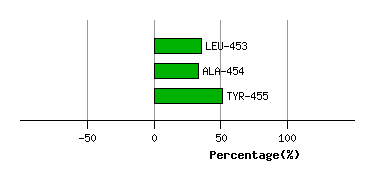
Graph shows rotational transition at bending residues and can be used
to identify hinge bending residues.
Probably only informative for interdomain rotations greater than 20 degrees
Residue
iResidue
i+1Distance of hinge axis to residue i in
(A) Distance of hinge axis to residue i in
(A) Change in
(deg) Change in
(deg) Angle of psi(i) axis to hinge axis
(deg) Angle of psi(i) axis to hinge axis
(deg) Percentage Progress
ALA-480
ALA-481
5.1
5.3
14.4
-13.6
31.4
26.1
7.3
ALA-481
TYR-482
3.7
4.0
-5.9
3.3
82.4
88.2
-12.8
TYR-482
VAL-483
1.2
1.0
0.6
-7.8
109.2
112.2
21.9
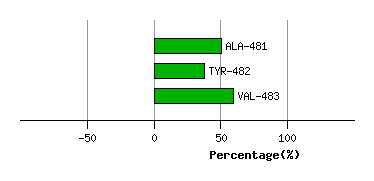
Graph shows rotational transition at bending residues and can be used
to identify hinge bending residues.
Probably only informative for interdomain rotations greater than 20 degrees