Aconitase (E.C.4.2.1.3)
(All numbering and residues are taken from first PDB file)
![]()
![]()
Bending Residue Dihedral Analysis
Residue
iResidue
i+1Distance of hinge axis to residue i in
(A) Distance of hinge axis to residue i in
(A) Change in
(deg) Change in
(deg) Angle of psi(i) axis to hinge axis
(deg) Angle of psi(i) axis to hinge axis
(deg) Percentage Progress
LYS-4
VAL-5
19.1
19.2
-12.9
4.0
55.1
50.4
227.4
VAL-5
ALA-6
16.2
16.3
14.9
-18.8
115.8
116.9
-134.3
ALA-6
MET-7
14.2
14.1
15.6
-1.4
81.1
81.7
151.6
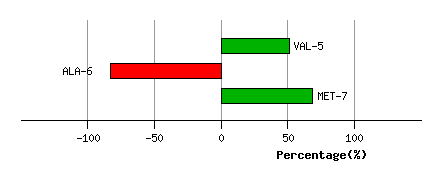
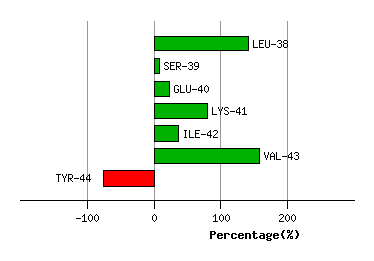
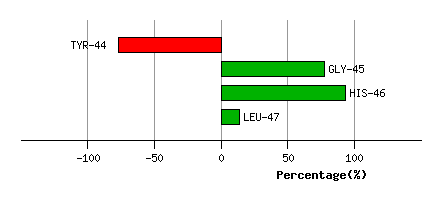
Graph shows rotational transition at bending residues and can be used
to identify hinge bending residues.
Probably only informative for interdomain rotations greater than 20 degrees
Residue
iResidue
i+1Distance of hinge axis to residue i in
(A) Distance of hinge axis to residue i in
(A) Change in
(deg) Change in
(deg) Angle of psi(i) axis to hinge axis
(deg) Angle of psi(i) axis to hinge axis
(deg) Percentage Progress
PHE-10
GLU-11
10.8
10.5
2.3
-6.3
115.0
115.4
235.7
GLU-11
PRO-12
12.7
12.5
-8.8
-2.0
57.6
61.0
157.3
PRO-12
HIS-13
15.8
15.4
-3.5
17.7
44.0
50.4
-171.6
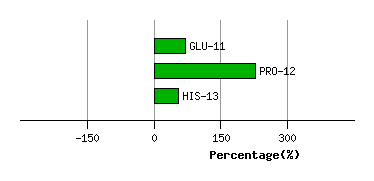
Graph shows rotational transition at bending residues and can be used
to identify hinge bending residues.
Probably only informative for interdomain rotations greater than 20 degrees
Residue
iResidue
i+1Distance of hinge axis to residue i in
(A) Distance of hinge axis to residue i in
(A) Change in
(deg) Change in
(deg) Angle of psi(i) axis to hinge axis
(deg) Angle of psi(i) axis to hinge axis
(deg) Percentage Progress
LEU-21
GLU-22
9.7
9.5
-2.5
-5.3
162.1
163.0
-260.3
GLU-22
LYS-23
10.9
10.6
4.5
-6.8
52.0
54.2
74.2
LYS-23
ASN-24
13.1
13.0
9.5
-6.1
72.1
75.7
84.8

Graph shows rotational transition at bending residues and can be used
to identify hinge bending residues.
Probably only informative for interdomain rotations greater than 20 degrees
Residue
iResidue
i+1Distance of hinge axis to residue i in
(A) Distance of hinge axis to residue i in
(A) Change in
(deg) Change in
(deg) Angle of psi(i) axis to hinge axis
(deg) Angle of psi(i) axis to hinge axis
(deg) Percentage Progress
ILE-27
VAL-28
11.6
11.6
4.2
0.2
111.3
105.8
-22.6
VAL-28
ARG-29
8.8
8.7
-13.2
31.7
42.2
36.8
-743.2
ARG-29
LYS-30
6.4
6.3
-27.6
-12.4
31.2
27.1
1211.2
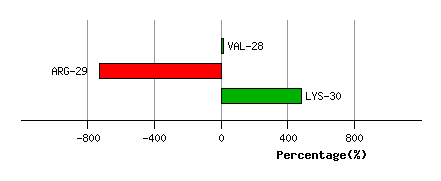
Graph shows rotational transition at bending residues and can be used
to identify hinge bending residues.
Probably only informative for interdomain rotations greater than 20 degrees
Residue
iResidue
i+1Distance of hinge axis to residue i in
(A) Distance of hinge axis to residue i in
(A) Change in
(deg) Change in
(deg) Angle of psi(i) axis to hinge axis
(deg) Angle of psi(i) axis to hinge axis
(deg) Percentage Progress
ARG-31
LEU-32
9.7
9.8
1.0
3.8
72.2
73.1
187.8
LEU-32
ASN-33
6.5
6.7
3.6
1.3
45.1
44.9
78.6
ASN-33
ARG-34
4.4
4.5
-2.2
-2.9
89.5
84.7
44.0
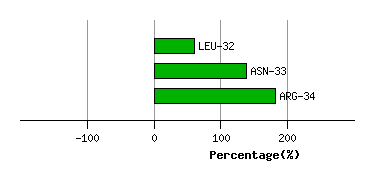
Graph shows rotational transition at bending residues and can be used
to identify hinge bending residues.
Probably only informative for interdomain rotations greater than 20 degrees
Residue
iResidue
i+1Distance of hinge axis to residue i in
(A) Distance of hinge axis to residue i in
(A) Change in
(deg) Change in
(deg) Angle of psi(i) axis to hinge axis
(deg) Angle of psi(i) axis to hinge axis
(deg) Percentage Progress
THR-37
LEU-38
3.4
3.4
0.3
2.0
39.1
35.7
73.3
LEU-38
SER-39
3.1
3.1
-5.6
-3.8
120.4
118.4
-134.0
SER-39
GLU-40
2.8
2.8
11.8
-8.7
117.6
120.4
15.3
GLU-40
LYS-41
2.9
2.8
-0.6
0.7
98.7
97.0
56.4
LYS-41
ILE-42
2.3
2.3
3.5
1.7
26.6
27.8
-42.6
ILE-42
VAL-43
2.7
2.6
-2.1
0.8
96.5
99.1
121.5
VAL-43
TYR-44
5.1
5.2
-2.8
4.8
125.1
123.2
-18.0
VAL-43
TYR-44
5.1
5.2
-2.8
4.8
125.1
123.2
-18.0
Graph shows rotational transition at bending residues and can be used
to identify hinge bending residues.
Probably only informative for interdomain rotations greater than 20 degrees
Residue
iResidue
i+1Distance of hinge axis to residue i in
(A) Distance of hinge axis to residue i in
(A) Change in
(deg) Change in
(deg) Angle of psi(i) axis to hinge axis
(deg) Angle of psi(i) axis to hinge axis
(deg) Percentage Progress
VAL-43
TYR-44
5.1
5.2
-2.8
4.8
125.1
123.2
-18.0
VAL-43
TYR-44
5.1
5.2
-2.8
4.8
125.1
123.2
-18.0
TYR-44
GLY-45
6.8
6.8
2.5
-5.4
104.7
103.6
154.2
GLY-45
HIS-46
7.2
7.3
1.0
-2.9
140.7
140.8
15.8
HIS-46
LEU-47
8.9
8.9
-1.2
-0.1
104.0
102.6
-79.8
Graph shows rotational transition at bending residues and can be used
to identify hinge bending residues.
Probably only informative for interdomain rotations greater than 20 degrees
Residue
iResidue
i+1Distance of hinge axis to residue i in
(A) Distance of hinge axis to residue i in
(A) Change in
(deg) Change in
(deg) Angle of psi(i) axis to hinge axis
(deg) Angle of psi(i) axis to hinge axis
(deg) Percentage Progress
LYS-59
THR-60
16.8
17.0
-11.8
8.4
66.3
60.3
-154.6
THR-60
TYR-61
16.2
16.4
-1.5
2.3
12.4
13.9
76.8
TYR-61
LEU-62
16.3
16.3
-3.9
7.7
91.2
93.2
90.6
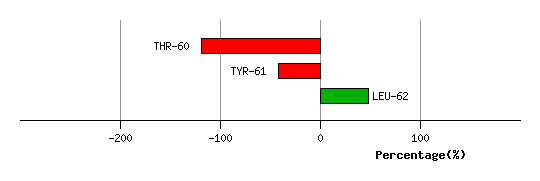
Graph shows rotational transition at bending residues and can be used
to identify hinge bending residues.
Probably only informative for interdomain rotations greater than 20 degrees
Residue
iResidue
i+1Distance of hinge axis to residue i in
(A) Distance of hinge axis to residue i in
(A) Change in
(deg) Change in
(deg) Angle of psi(i) axis to hinge axis
(deg) Angle of psi(i) axis to hinge axis
(deg) Percentage Progress
ARG-65
PRO-66
12.1
12.1
-0.3
-2.3
120.6
122.2
152.3
PRO-66
ASP-67
9.3
9.2
-2.2
6.1
120.2
121.0
-12.3
ASP-67
ARG-68
8.6
8.4
-9.0
10.9
169.7
170.3
49.6
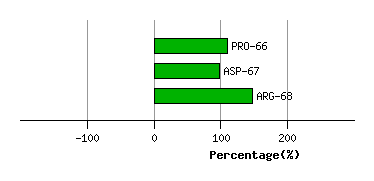
Graph shows rotational transition at bending residues and can be used
to identify hinge bending residues.
Probably only informative for interdomain rotations greater than 20 degrees
Residue
iResidue
i+1Distance of hinge axis to residue i in
(A) Distance of hinge axis to residue i in
(A) Change in
(deg) Change in
(deg) Angle of psi(i) axis to hinge axis
(deg) Angle of psi(i) axis to hinge axis
(deg) Percentage Progress
ASP-100
HIS-101
8.2
8.5
-6.7
6.1
86.1
87.7
-8.6
HIS-101
LEU-102
11.9
12.0
-1.4
5.1
30.4
30.4
30.8
LEU-102
ILE-103
12.8
13.0
7.4
-17.3
137.6
137.2
214.9
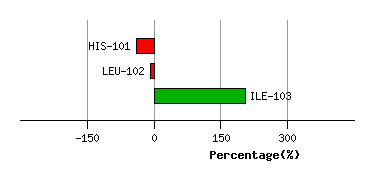
Graph shows rotational transition at bending residues and can be used
to identify hinge bending residues.
Probably only informative for interdomain rotations greater than 20 degrees
Residue
iResidue
i+1Distance of hinge axis to residue i in
(A) Distance of hinge axis to residue i in
(A) Change in
(deg) Change in
(deg) Angle of psi(i) axis to hinge axis
(deg) Angle of psi(i) axis to hinge axis
(deg) Percentage Progress
ASP-112
LEU-113
12.5
12.8
0.3
-4.2
104.4
104.2
75.0
LEU-113
ARG-114
8.9
9.1
3.3
1.5
41.0
36.1
160.5
ARG-114
ARG-115
7.9
8.3
-7.7
6.4
98.8
92.1
-75.8
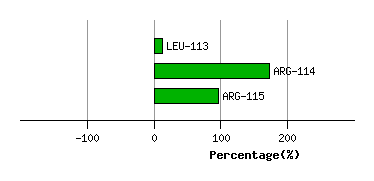
Graph shows rotational transition at bending residues and can be used
to identify hinge bending residues.
Probably only informative for interdomain rotations greater than 20 degrees
Residue
iResidue
i+1Distance of hinge axis to residue i in
(A) Distance of hinge axis to residue i in
(A) Change in
(deg) Change in
(deg) Angle of psi(i) axis to hinge axis
(deg) Angle of psi(i) axis to hinge axis
(deg) Percentage Progress
ALA-155
TYR-156
3.4
3.5
3.7
0.8
63.4
65.7
240.5
TYR-156
PRO-157
6.1
6.0
1.2
-12.1
15.0
17.5
-250.2
PRO-157
GLY-158
6.2
6.0
7.0
0.7
68.0
65.3
138.9
GLY-158
VAL-159
4.4
4.5
-8.5
-1.3
54.2
51.8
80.7
VAL-159
LEU-160
3.9
3.8
-2.9
0.1
107.1
107.0
-219.2
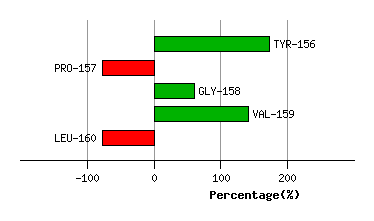
Graph shows rotational transition at bending residues and can be used
to identify hinge bending residues.
Probably only informative for interdomain rotations greater than 20 degrees
Residue
iResidue
i+1Distance of hinge axis to residue i in
(A) Distance of hinge axis to residue i in
(A) Change in
(deg) Change in
(deg) Angle of psi(i) axis to hinge axis
(deg) Angle of psi(i) axis to hinge axis
(deg) Percentage Progress
LEU-161
ILE-162
4.5
4.6
3.5
-2.2
94.7
93.6
133.5
ILE-162
GLY-163
7.4
7.6
4.3
-8.1
167.8
167.2
34.7
GLY-163
THR-164
8.0
8.1
-2.6
-5.1
80.6
81.0
-36.4
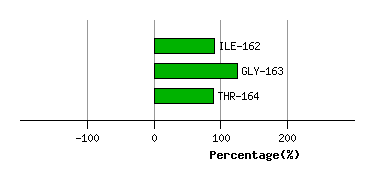
Graph shows rotational transition at bending residues and can be used
to identify hinge bending residues.
Probably only informative for interdomain rotations greater than 20 degrees
Residue
iResidue
i+1Distance of hinge axis to residue i in
(A) Distance of hinge axis to residue i in
(A) Change in
(deg) Change in
(deg) Angle of psi(i) axis to hinge axis
(deg) Angle of psi(i) axis to hinge axis
(deg) Percentage Progress
ILE-177
CYS-178
2.3
2.5
-1.9
4.0
147.3
146.5
-10.0
CYS-178
ILE-179
4.1
4.3
-5.3
5.7
86.8
87.9
-91.8
ILE-179
GLY-180
7.8
8.0
6.3
-5.1
36.6
33.1
62.0
GLY-180
VAL-181
10.6
10.6
7.4
-0.3
103.6
106.0
96.3
VAL-181
GLY-182
13.3
13.3
0.6
-7.6
30.8
34.3
-251.8
GLY-182
GLY-183
16.2
16.2
-3.9
5.3
114.9
113.1
244.4
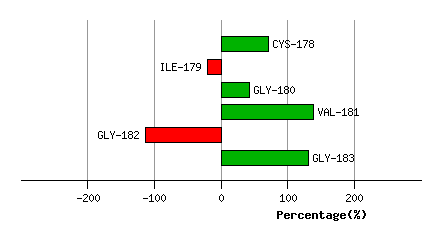
Graph shows rotational transition at bending residues and can be used
to identify hinge bending residues.
Probably only informative for interdomain rotations greater than 20 degrees
Residue
iResidue
i+1Distance of hinge axis to residue i in
(A) Distance of hinge axis to residue i in
(A) Change in
(deg) Change in
(deg) Angle of psi(i) axis to hinge axis
(deg) Angle of psi(i) axis to hinge axis
(deg) Percentage Progress
VAL-187
ASP-188
17.2
16.8
28.5
-18.8
36.8
32.8
204.5
ASP-188
VAL-189
17.8
17.6
1.6
7.6
86.0
84.2
65.9
VAL-189
MET-190
14.8
14.6
-5.7
6.4
39.9
38.8
76.1
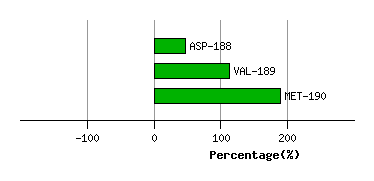
Graph shows rotational transition at bending residues and can be used
to identify hinge bending residues.
Probably only informative for interdomain rotations greater than 20 degrees
Residue
iResidue
i+1Distance of hinge axis to residue i in
(A) Distance of hinge axis to residue i in
(A) Change in
(deg) Change in
(deg) Angle of psi(i) axis to hinge axis
(deg) Angle of psi(i) axis to hinge axis
(deg) Percentage Progress
ALA-191
GLY-192
19.1
19.1
4.8
-2.2
139.8
140.2
30.4
GLY-192
ILE-193
18.4
18.4
3.9
-2.2
149.0
153.1
-61.5
ILE-193
PRO-194
19.4
19.2
2.7
2.1
120.8
121.9
134.3
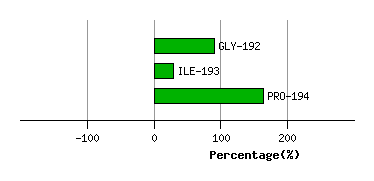
Graph shows rotational transition at bending residues and can be used
to identify hinge bending residues.
Probably only informative for interdomain rotations greater than 20 degrees
Residue
iResidue
i+1Distance of hinge axis to residue i in
(A) Distance of hinge axis to residue i in
(A) Change in
(deg) Change in
(deg) Angle of psi(i) axis to hinge axis
(deg) Angle of psi(i) axis to hinge axis
(deg) Percentage Progress
GLU-196
LEU-197
15.7
15.6
-5.6
9.9
88.6
88.7
7.9
LEU-197
LYS-198
13.9
13.7
-7.0
10.0
161.0
156.5
109.5
LYS-198
CYS-199
14.9
15.0
-3.5
0.8
109.1
111.9
-76.5
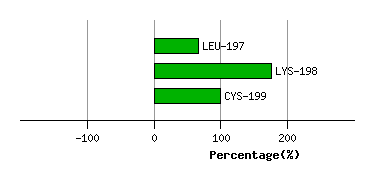
Graph shows rotational transition at bending residues and can be used
to identify hinge bending residues.
Probably only informative for interdomain rotations greater than 20 degrees
Residue
iResidue
i+1Distance of hinge axis to residue i in
(A) Distance of hinge axis to residue i in
(A) Change in
(deg) Change in
(deg) Angle of psi(i) axis to hinge axis
(deg) Angle of psi(i) axis to hinge axis
(deg) Percentage Progress
PRO-200
LYS-201
11.1
11.1
0.2
-9.5
147.6
147.8
271.0
LYS-201
VAL-202
11.7
11.8
-3.6
2.0
113.5
111.2
-171.7
VAL-202
ILE-203
9.9
9.9
-1.3
1.0
77.2
78.8
27.4
ILE-203
GLY-204
12.7
12.7
1.4
-3.1
82.2
83.6
-28.9
GLY-204
VAL-205
12.3
12.3
-18.1
17.7
108.0
105.8
-31.1
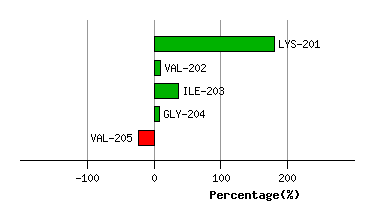
Graph shows rotational transition at bending residues and can be used
to identify hinge bending residues.
Probably only informative for interdomain rotations greater than 20 degrees
Residue
iResidue
i+1Distance of hinge axis to residue i in
(A) Distance of hinge axis to residue i in
(A) Change in
(deg) Change in
(deg) Angle of psi(i) axis to hinge axis
(deg) Angle of psi(i) axis to hinge axis
(deg) Percentage Progress
ASN-273
HIS-274
13.7
13.6
5.3
0.2
36.2
38.4
107.7
HIS-274
ARG-275
16.8
16.8
-3.2
1.1
150.7
153.0
-18.0
ARG-275
MET-276
16.1
16.1
-5.7
1.6
120.2
120.6
-94.5
MET-276
LYS-277
12.7
12.7
8.5
-5.5
108.2
107.8
-30.5
MET-276
LYS-277
12.7
12.7
8.5
-5.5
108.2
107.8
-30.5
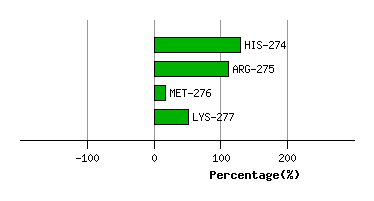
Graph shows rotational transition at bending residues and can be used
to identify hinge bending residues.
Probably only informative for interdomain rotations greater than 20 degrees
Residue
iResidue
i+1Distance of hinge axis to residue i in
(A) Distance of hinge axis to residue i in
(A) Change in
(deg) Change in
(deg) Angle of psi(i) axis to hinge axis
(deg) Angle of psi(i) axis to hinge axis
(deg) Percentage Progress
MET-276
LYS-277
12.7
12.7
8.5
-5.5
108.2
107.8
-30.5
MET-276
LYS-277
12.7
12.7
8.5
-5.5
108.2
107.8
-30.5
LYS-277
LYS-278
14.8
14.9
-5.2
9.1
31.3
30.7
-139.7
LYS-278
TYR-279
17.0
17.1
-11.3
4.5
38.0
38.6
160.5
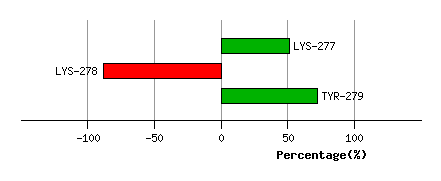
Graph shows rotational transition at bending residues and can be used
to identify hinge bending residues.
Probably only informative for interdomain rotations greater than 20 degrees
Residue
iResidue
i+1Distance of hinge axis to residue i in
(A) Distance of hinge axis to residue i in
(A) Change in
(deg) Change in
(deg) Angle of psi(i) axis to hinge axis
(deg) Angle of psi(i) axis to hinge axis
(deg) Percentage Progress
LEU-291
ALA-292
15.5
15.4
-3.2
1.1
50.6
44.1
75.7
ALA-292
ASP-293
12.5
12.6
-0.4
-2.8
45.9
44.3
31.2
ASP-293
GLU-294
15.4
15.3
2.1
-4.7
137.0
135.9
111.7
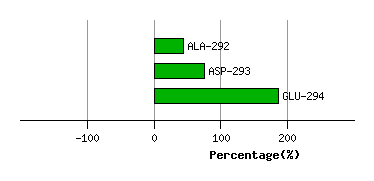
Graph shows rotational transition at bending residues and can be used
to identify hinge bending residues.
Probably only informative for interdomain rotations greater than 20 degrees
Residue
iResidue
i+1Distance of hinge axis to residue i in
(A) Distance of hinge axis to residue i in
(A) Change in
(deg) Change in
(deg) Angle of psi(i) axis to hinge axis
(deg) Angle of psi(i) axis to hinge axis
(deg) Percentage Progress
GLY-304
CYS-305
7.7
7.7
-4.6
-4.3
71.0
70.2
155.9
CYS-305
HIS-306
5.6
5.6
6.5
-9.2
86.4
88.4
-116.3
HIS-306
TYR-307
7.8
7.9
-1.4
-1.2
32.5
34.0
72.7
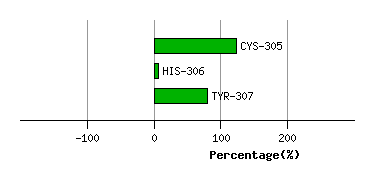
Graph shows rotational transition at bending residues and can be used
to identify hinge bending residues.
Probably only informative for interdomain rotations greater than 20 degrees
Residue
iResidue
i+1Distance of hinge axis to residue i in
(A) Distance of hinge axis to residue i in
(A) Change in
(deg) Change in
(deg) Angle of psi(i) axis to hinge axis
(deg) Angle of psi(i) axis to hinge axis
(deg) Percentage Progress
VAL-352
GLY-353
28.1
28.0
-3.4
1.9
29.3
32.7
66.5
GLY-353
LEU-354
26.4
26.4
-8.1
6.7
102.6
102.0
30.9
LEU-354
ILE-355
22.6
22.6
-0.6
-6.1
46.6
44.8
144.8
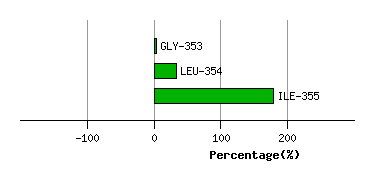
Graph shows rotational transition at bending residues and can be used
to identify hinge bending residues.
Probably only informative for interdomain rotations greater than 20 degrees
Residue
iResidue
i+1Distance of hinge axis to residue i in
(A) Distance of hinge axis to residue i in
(A) Change in
(deg) Change in
(deg) Angle of psi(i) axis to hinge axis
(deg) Angle of psi(i) axis to hinge axis
(deg) Percentage Progress
TYR-363
GLU-364
16.4
17.1
9.2
-0.8
64.9
65.5
-18.7
GLU-364
ASP-365
18.9
19.5
-0.4
-6.8
78.8
75.2
-13.0
ASP-365
MET-366
19.1
19.5
-5.0
5.5
24.2
23.2
-59.5
MET-366
GLY-367
19.7
19.9
-9.5
6.5
91.3
87.0
65.4
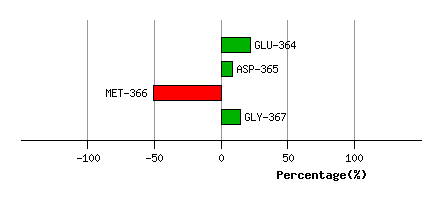
Graph shows rotational transition at bending residues and can be used
to identify hinge bending residues.
Probably only informative for interdomain rotations greater than 20 degrees
Residue
iResidue
i+1Distance of hinge axis to residue i in
(A) Distance of hinge axis to residue i in
(A) Change in
(deg) Change in
(deg) Angle of psi(i) axis to hinge axis
(deg) Angle of psi(i) axis to hinge axis
(deg) Percentage Progress
PRO-391
GLY-392
13.4
13.1
-0.9
-4.5
65.8
64.6
32.8
GLY-392
SER-393
10.7
10.4
-7.4
11.4
111.6
110.1
-37.6
SER-393
GLU-394
8.2
7.9
-4.3
7.9
141.9
142.6
-61.3
GLU-394
GLN-395
8.3
8.2
-0.5
0.4
75.6
67.5
82.9
GLN-395
ILE-396
10.5
10.3
11.2
-15.1
99.9
102.5
-165.6
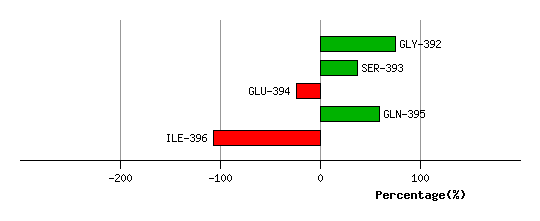
Graph shows rotational transition at bending residues and can be used
to identify hinge bending residues.
Probably only informative for interdomain rotations greater than 20 degrees
Residue
iResidue
i+1Distance of hinge axis to residue i in
(A) Distance of hinge axis to residue i in
(A) Change in
(deg) Change in
(deg) Angle of psi(i) axis to hinge axis
(deg) Angle of psi(i) axis to hinge axis
(deg) Percentage Progress
VAL-442
THR-443
27.3
27.2
-4.6
1.4
103.9
101.5
26.1
THR-443
SER-444
23.5
23.4
1.9
1.7
137.6
137.7
-92.9
SER-444
TYR-445
21.1
21.0
-4.5
-1.8
77.2
76.7
224.8
TYR-445
ASN-446
19.1
18.9
-2.1
15.6
16.2
18.2
-368.2
ASN-446
ARG-447
19.0
18.5
-43.9
50.0
83.4
82.8
197.3
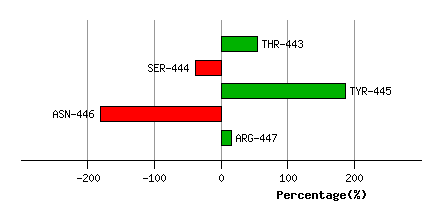
Graph shows rotational transition at bending residues and can be used
to identify hinge bending residues.
Probably only informative for interdomain rotations greater than 20 degrees
Residue
iResidue
i+1Distance of hinge axis to residue i in
(A) Distance of hinge axis to residue i in
(A) Change in
(deg) Change in
(deg) Angle of psi(i) axis to hinge axis
(deg) Angle of psi(i) axis to hinge axis
(deg) Percentage Progress
THR-450
GLY-451
29.0
28.6
3.1
16.6
35.0
39.9
431.4
GLY-451
ARG-452
28.1
27.5
-10.2
11.2
96.1
95.4
191.3
ARG-452
ASN-453
24.3
23.8
-21.4
5.4
133.2
145.3
-315.8
ASN-453
ASP-454
23.5
23.3
-8.2
12.4
162.0
157.8
133.1
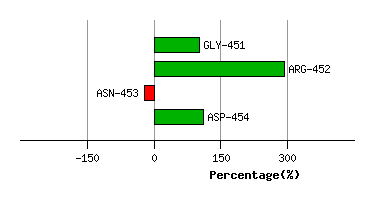
Graph shows rotational transition at bending residues and can be used
to identify hinge bending residues.
Probably only informative for interdomain rotations greater than 20 degrees
Residue
iResidue
i+1Distance of hinge axis to residue i in
(A) Distance of hinge axis to residue i in
(A) Change in
(deg) Change in
(deg) Angle of psi(i) axis to hinge axis
(deg) Angle of psi(i) axis to hinge axis
(deg) Percentage Progress
PRO-520
PRO-521
13.1
13.2
-0.6
-20.6
108.8
100.4
-44.6
PRO-521
LYS-522
16.3
16.5
-7.0
59.2
36.2
45.8
-878.6
LYS-522
ASP-523
18.5
19.1
-73.5
110.4
98.9
128.1
1050.4
ASP-523
SER-524
21.3
20.9
20.3
-24.2
62.9
82.1
679.6
SER-524
SER-525
21.1
20.5
146.2
-97.8
116.6
111.5
102.4
SER-525
GLY-526
19.8
23.8
59.8
-133.2
69.1
30.9
-1622.7
GLY-526
GLN-527
22.1
23.2
1.9
-12.4
58.5
77.1
265.3
GLN-527
ARG-528
19.5
19.8
9.8
-37.3
101.3
89.5
510.1
ARG-528
VAL-529
21.4
20.8
4.9
-27.3
93.7
89.7
-14.7
VAL-529
ASP-530
19.6
19.4
-6.0
-19.5
119.6
112.2
127.5
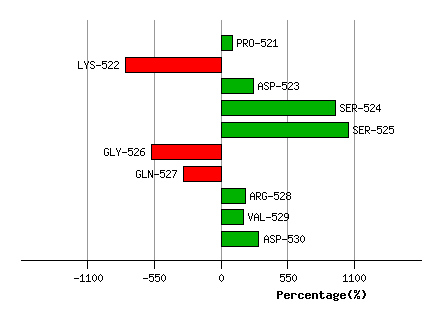
Graph shows rotational transition at bending residues and can be used
to identify hinge bending residues.
Probably only informative for interdomain rotations greater than 20 degrees