Archaeosine Trna-Guanine Transglycosylase
(All numbering and residues are taken from first PDB file)
![]()
![]()
Bending Residue Dihedral Analysis
Residue
iResidue
i+1Distance of hinge axis to residue i in
(A) Distance of hinge axis to residue i in
(A) Change in
(deg) Change in
(deg) Angle of psi(i) axis to hinge axis
(deg) Angle of psi(i) axis to hinge axis
(deg) Percentage Progress
LEU-356
GLU-357
6.3
5.9
3.9
3.9
83.3
83.1
13.9
GLU-357
GLU-358
5.3
5.1
-7.6
3.2
34.1
36.0
47.4
GLU-358
PHE-359
5.9
5.6
-3.0
6.4
66.4
69.3
-8.8
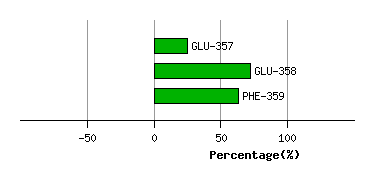
Graph shows rotational transition at bending residues and can be used
to identify hinge bending residues.
Probably only informative for interdomain rotations greater than 20 degrees
Residue
iResidue
i+1Distance of hinge axis to residue i in
(A) Distance of hinge axis to residue i in
(A) Change in
(deg) Change in
(deg) Angle of psi(i) axis to hinge axis
(deg) Angle of psi(i) axis to hinge axis
(deg) Percentage Progress
LYS-364
LYS-365
8.8
9.0
-3.9
9.9
62.5
66.3
30.7
LYS-365
SER-366
12.2
12.5
-1.6
-10.3
31.2
26.3
159.2
SER-366
ALA-367
11.1
11.8
1.5
8.2
135.9
134.7
-95.7
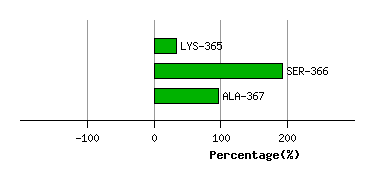
Graph shows rotational transition at bending residues and can be used
to identify hinge bending residues.
Probably only informative for interdomain rotations greater than 20 degrees
Residue
iResidue
i+1Distance of hinge axis to residue i in
(A) Distance of hinge axis to residue i in
(A) Change in
(deg) Change in
(deg) Angle of psi(i) axis to hinge axis
(deg) Angle of psi(i) axis to hinge axis
(deg) Percentage Progress
LEU-368
PHE-369
6.4
7.0
3.3
9.5
36.3
37.6
136.1
PHE-369
LYS-370
7.7
8.3
-8.8
4.4
107.6
113.4
-10.5
LYS-370
ILE-371
6.6
6.9
-8.2
-2.5
103.3
104.3
-116.0
ILE-371
SER-372
10.1
10.3
-1.0
3.9
95.8
96.4
-1.0
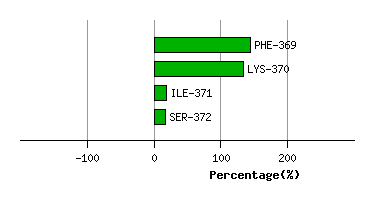
Graph shows rotational transition at bending residues and can be used
to identify hinge bending residues.
Probably only informative for interdomain rotations greater than 20 degrees
Residue
iResidue
i+1Distance of hinge axis to residue i in
(A) Distance of hinge axis to residue i in
(A) Change in
(deg) Change in
(deg) Angle of psi(i) axis to hinge axis
(deg) Angle of psi(i) axis to hinge axis
(deg) Percentage Progress
TRP-378
PRO-379
4.5
4.5
2.4
-7.3
112.9
110.3
23.9
PRO-379
VAL-380
3.6
3.3
7.8
-2.5
69.9
70.1
1.1
VAL-380
VAL-381
1.5
1.2
-1.7
4.1
156.2
155.3
38.2
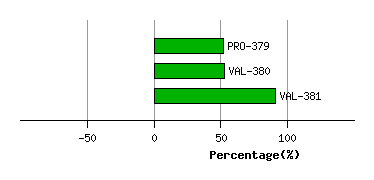
Graph shows rotational transition at bending residues and can be used
to identify hinge bending residues.
Probably only informative for interdomain rotations greater than 20 degrees
Residue
iResidue
i+1Distance of hinge axis to residue i in
(A) Distance of hinge axis to residue i in
(A) Change in
(deg) Change in
(deg) Angle of psi(i) axis to hinge axis
(deg) Angle of psi(i) axis to hinge axis
(deg) Percentage Progress
VAL-399
GLU-400
11.0
11.2
-15.7
21.3
94.4
97.3
-30.1
GLU-400
HIS-401
7.3
7.5
-4.2
6.6
139.4
139.2
31.2
HIS-401
PRO-402
5.3
5.6
-1.4
4.0
84.8
86.6
69.7
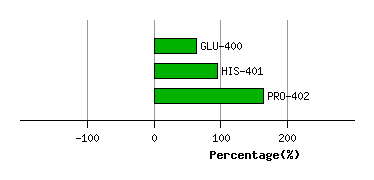
Graph shows rotational transition at bending residues and can be used
to identify hinge bending residues.
Probably only informative for interdomain rotations greater than 20 degrees
Residue
iResidue
i+1Distance of hinge axis to residue i in
(A) Distance of hinge axis to residue i in
(A) Change in
(deg) Change in
(deg) Angle of psi(i) axis to hinge axis
(deg) Angle of psi(i) axis to hinge axis
(deg) Percentage Progress
ILE-403
PHE-404
0.9
1.4
2.0
-3.1
95.6
95.1
13.2
PHE-404
GLY-405
3.8
3.6
7.1
-2.3
31.0
31.2
64.5
GLY-405
ARG-406
4.5
4.4
-0.7
2.5
105.6
102.7
21.4
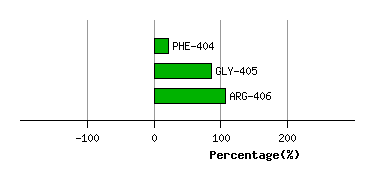
Graph shows rotational transition at bending residues and can be used
to identify hinge bending residues.
Probably only informative for interdomain rotations greater than 20 degrees
Residue
iResidue
i+1Distance of hinge axis to residue i in
(A) Distance of hinge axis to residue i in
(A) Change in
(deg) Change in
(deg) Angle of psi(i) axis to hinge axis
(deg) Angle of psi(i) axis to hinge axis
(deg) Percentage Progress
GLN-419
SER-420
10.9
10.7
61.1
-90.2
114.8
99.4
200.5
SER-420
GLU-421
7.6
8.2
15.6
8.3
138.9
145.4
-249.1
GLU-421
ALA-422
8.5
9.0
7.4
0.1
104.3
109.3
-49.6
ALA-422
GLU-423
7.5
7.7
-11.2
5.0
40.2
39.9
38.7
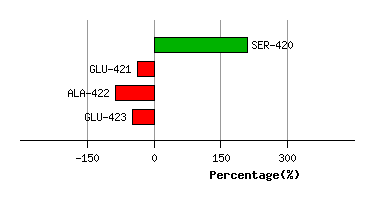
Graph shows rotational transition at bending residues and can be used
to identify hinge bending residues.
Probably only informative for interdomain rotations greater than 20 degrees