Hla Class II Histocompatibility Antigen
(All numbering and residues are taken from first PDB file)
![]()
![]()
Bending Residue Dihedral Analysis
Residue
iResidue
i+1Distance of hinge axis to residue i in
(A) Distance of hinge axis to residue i in
(A) Change in
(deg) Change in
(deg) Angle of psi(i) axis to hinge axis
(deg) Angle of psi(i) axis to hinge axis
(deg) Percentage Progress
GLN-9
ALA-10
6.3
6.0
1.2
-9.4
155.8
154.3
194.6
ALA-10
GLU-11
6.5
6.4
-17.2
20.9
65.3
66.3
-57.9
GLU-11
PHE-12
8.8
8.8
-9.3
9.5
32.1
32.0
-34.0
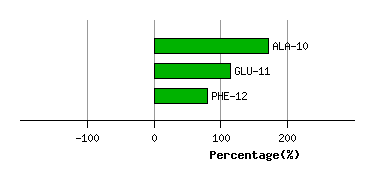
Graph shows rotational transition at bending residues and can be used
to identify hinge bending residues.
Probably only informative for interdomain rotations greater than 20 degrees
Residue
iResidue
i+1Distance of hinge axis to residue i in
(A) Distance of hinge axis to residue i in
(A) Change in
(deg) Change in
(deg) Angle of psi(i) axis to hinge axis
(deg) Angle of psi(i) axis to hinge axis
(deg) Percentage Progress
PHE-22
MET-23
8.4
8.3
-3.4
8.0
68.1
68.4
-92.6
MET-23
PHE-24
5.2
4.9
7.4
-10.2
133.3
132.4
58.4
PHE-24
ASP-25
2.8
2.5
-6.6
7.1
105.2
105.4
21.0
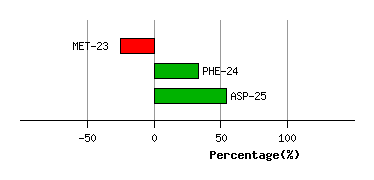
Graph shows rotational transition at bending residues and can be used
to identify hinge bending residues.
Probably only informative for interdomain rotations greater than 20 degrees
Residue
iResidue
i+1Distance of hinge axis to residue i in
(A) Distance of hinge axis to residue i in
(A) Change in
(deg) Change in
(deg) Angle of psi(i) axis to hinge axis
(deg) Angle of psi(i) axis to hinge axis
(deg) Percentage Progress
ILE-31
PHE-32
4.3
4.3
-4.7
6.6
72.6
75.1
2.2
PHE-32
HIS-33
6.2
6.1
1.9
-4.7
122.9
127.6
70.0
HIS-33
VAL-34
7.3
7.3
3.0
-5.1
85.1
82.0
11.9
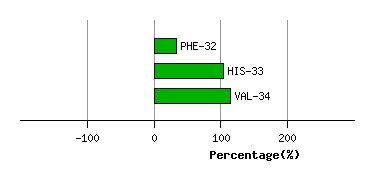
Graph shows rotational transition at bending residues and can be used
to identify hinge bending residues.
Probably only informative for interdomain rotations greater than 20 degrees
Residue
iResidue
i+1Distance of hinge axis to residue i in
(A) Distance of hinge axis to residue i in
(A) Change in
(deg) Change in
(deg) Angle of psi(i) axis to hinge axis
(deg) Angle of psi(i) axis to hinge axis
(deg) Percentage Progress
VAL-42
TRP-43
11.6
11.5
6.0
-4.2
109.2
106.6
-14.1
TRP-43
ARG-44
10.0
9.9
0.9
-1.5
49.0
49.6
-19.8
ARG-44
LEU-45
9.0
9.1
3.3
-4.6
105.9
103.9
-0.3
LEU-45
GLU-46
11.8
11.9
-2.2
-2.0
52.4
49.1
131.8
GLU-46
GLU-47
14.6
14.4
7.7
3.0
169.7
165.0
-207.5
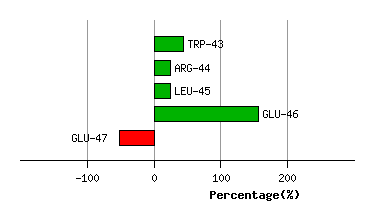
Graph shows rotational transition at bending residues and can be used
to identify hinge bending residues.
Probably only informative for interdomain rotations greater than 20 degrees
Residue
iResidue
i+1Distance of hinge axis to residue i in
(A) Distance of hinge axis to residue i in
(A) Change in
(deg) Change in
(deg) Angle of psi(i) axis to hinge axis
(deg) Angle of psi(i) axis to hinge axis
(deg) Percentage Progress
PRO-87
GLU-88
5.6
5.2
7.6
-6.0
71.8
72.5
29.8
GLU-88
VAL-89
8.9
8.4
22.0
-22.4
111.2
105.5
33.3
VAL-89
THR-90
9.2
9.1
-8.0
2.1
83.3
84.2
-7.4
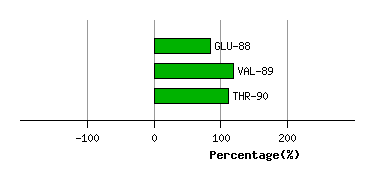
Graph shows rotational transition at bending residues and can be used
to identify hinge bending residues.
Probably only informative for interdomain rotations greater than 20 degrees
Residue
iResidue
i+1Distance of hinge axis to residue i in
(A) Distance of hinge axis to residue i in
(A) Change in
(deg) Change in
(deg) Angle of psi(i) axis to hinge axis
(deg) Angle of psi(i) axis to hinge axis
(deg) Percentage Progress
THR-113
PRO-114
6.1
6.1
-0.4
-1.9
30.1
30.9
-33.7
PRO-114
PRO-115
6.7
7.0
0.9
3.8
70.2
73.8
59.7
PRO-115
VAL-116
4.6
4.9
-0.6
0.3
64.8
63.3
58.4
VAL-116
VAL-117
5.1
5.4
-8.4
10.5
126.4
125.6
51.9
VAL-116
VAL-117
5.1
5.4
-8.4
10.5
126.4
125.6
51.9
Graph shows rotational transition at bending residues and can be used
to identify hinge bending residues.
Probably only informative for interdomain rotations greater than 20 degrees
Residue
iResidue
i+1Distance of hinge axis to residue i in
(A) Distance of hinge axis to residue i in
(A) Change in
(deg) Change in
(deg) Angle of psi(i) axis to hinge axis
(deg) Angle of psi(i) axis to hinge axis
(deg) Percentage Progress
VAL-116
VAL-117
5.1
5.4
-8.4
10.5
126.4
125.6
51.9
VAL-116
VAL-117
5.1
5.4
-8.4
10.5
126.4
125.6
51.9
VAL-117
ASN-118
4.0
3.9
-5.8
2.2
99.7
99.0
30.2
ASN-118
VAL-119
6.7
6.7
-7.4
8.3
91.0
92.9
14.4
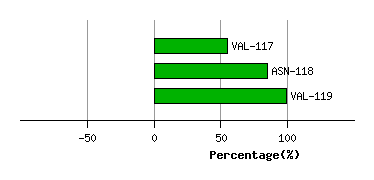
Graph shows rotational transition at bending residues and can be used
to identify hinge bending residues.
Probably only informative for interdomain rotations greater than 20 degrees
Residue
iResidue
i+1Distance of hinge axis to residue i in
(A) Distance of hinge axis to residue i in
(A) Change in
(deg) Change in
(deg) Angle of psi(i) axis to hinge axis
(deg) Angle of psi(i) axis to hinge axis
(deg) Percentage Progress
PHE-137
LEU-138
1.9
2.1
-6.9
5.7
147.1
144.3
-16.4
LEU-138
PRO-139
0.9
0.8
3.8
-1.2
100.6
102.8
54.7
PRO-139
ARG-140
4.3
4.2
-1.6
-12.2
90.2
87.0
76.3
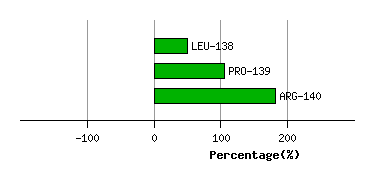
Graph shows rotational transition at bending residues and can be used
to identify hinge bending residues.
Probably only informative for interdomain rotations greater than 20 degrees
Residue
iResidue
i+1Distance of hinge axis to residue i in
(A) Distance of hinge axis to residue i in
(A) Change in
(deg) Change in
(deg) Angle of psi(i) axis to hinge axis
(deg) Angle of psi(i) axis to hinge axis
(deg) Percentage Progress
ARG-146
LYS-147
3.9
3.5
1.0
-13.7
101.3
94.7
51.4
LYS-147
PHE-148
4.2
4.1
4.9
-11.1
84.2
81.7
43.8
PHE-148
HIS-149
7.9
7.8
1.7
0.2
71.5
72.9
22.9
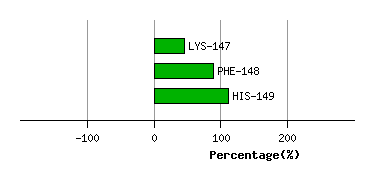
Graph shows rotational transition at bending residues and can be used
to identify hinge bending residues.
Probably only informative for interdomain rotations greater than 20 degrees
Residue
iResidue
i+1Distance of hinge axis to residue i in
(A) Distance of hinge axis to residue i in
(A) Change in
(deg) Change in
(deg) Angle of psi(i) axis to hinge axis
(deg) Angle of psi(i) axis to hinge axis
(deg) Percentage Progress
VAL-165
GLU-166
5.9
5.9
-5.0
-0.1
49.6
52.2
43.5
GLU-166
HIS-167
3.5
3.5
13.7
-18.6
54.3
55.0
-47.7
HIS-167
TRP-168
1.1
1.6
-13.3
16.4
44.7
46.9
2.1
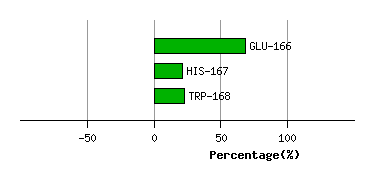
Graph shows rotational transition at bending residues and can be used
to identify hinge bending residues.
Probably only informative for interdomain rotations greater than 20 degrees
Residue
iResidue
i+1Distance of hinge axis to residue i in
(A) Distance of hinge axis to residue i in
(A) Change in
(deg) Change in
(deg) Angle of psi(i) axis to hinge axis
(deg) Angle of psi(i) axis to hinge axis
(deg) Percentage Progress
LEU-170
ASP-171
3.3
3.2
-10.7
32.2
148.1
163.4
312.2
ASP-171
GLU-172
2.9
3.4
-50.1
35.1
114.0
105.0
-180.7
GLU-172
PRO-173
2.2
2.3
16.2
-14.8
143.3
149.6
-65.7

Graph shows rotational transition at bending residues and can be used
to identify hinge bending residues.
Probably only informative for interdomain rotations greater than 20 degrees