Neopullulanase 2
(All numbering and residues are taken from first PDB file)
![]()
![]()
Bending Residue Dihedral Analysis
Residue
iResidue
i+1Distance of hinge axis to residue i in
(A) Distance of hinge axis to residue i in
(A) Change in
(deg) Change in
(deg) Angle of psi(i) axis to hinge axis
(deg) Angle of psi(i) axis to hinge axis
(deg) Percentage Progress
ALA-131
VAL-132
10.3
10.7
18.1
-17.6
111.8
110.7
14.9
VAL-132
ILE-133
11.1
10.9
-7.5
15.8
144.6
143.9
97.3
ILE-133
TYR-134
9.2
9.0
15.2
-15.9
83.7
83.3
4.9
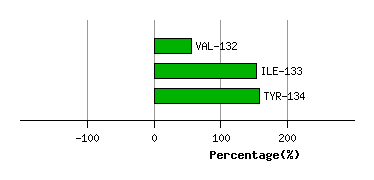
Graph shows rotational transition at bending residues and can be used
to identify hinge bending residues.
Probably only informative for interdomain rotations greater than 20 degrees
Residue
iResidue
i+1Distance of hinge axis to residue i in
(A) Distance of hinge axis to residue i in
(A) Change in
(deg) Change in
(deg) Angle of psi(i) axis to hinge axis
(deg) Angle of psi(i) axis to hinge axis
(deg) Percentage Progress
PHE-192
THR-193
7.7
7.8
25.1
-19.6
81.5
75.9
2.5
THR-193
PRO-194
9.4
9.4
3.6
2.1
157.0
149.9
-98.2
PRO-194
ILE-195
9.5
9.7
-11.5
-2.9
36.9
34.8
216.3
ILE-195
PHE-196
8.8
9.0
9.3
1.8
145.9
143.4
-154.5
PHE-196
ALA-197
9.0
8.9
-10.1
-3.1
68.3
60.9
64.8
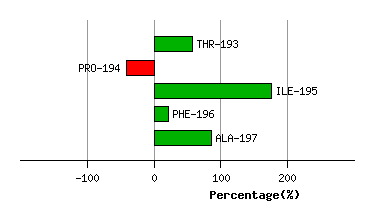
Graph shows rotational transition at bending residues and can be used
to identify hinge bending residues.
Probably only informative for interdomain rotations greater than 20 degrees
Residue
iResidue
i+1Distance of hinge axis to residue i in
(A) Distance of hinge axis to residue i in
(A) Change in
(deg) Change in
(deg) Angle of psi(i) axis to hinge axis
(deg) Angle of psi(i) axis to hinge axis
(deg) Percentage Progress
ILE-212
ASP-213
7.1
7.3
11.0
-1.4
71.6
68.3
107.8
ASP-213
PRO-214
10.9
11.0
5.8
5.7
51.9
47.8
104.9
PRO-214
GLN-215
12.3
12.5
-6.3
-9.3
68.0
71.7
16.0
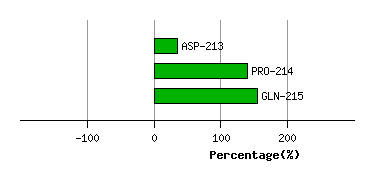
Graph shows rotational transition at bending residues and can be used
to identify hinge bending residues.
Probably only informative for interdomain rotations greater than 20 degrees
Residue
iResidue
i+1Distance of hinge axis to residue i in
(A) Distance of hinge axis to residue i in
(A) Change in
(deg) Change in
(deg) Angle of psi(i) axis to hinge axis
(deg) Angle of psi(i) axis to hinge axis
(deg) Percentage Progress
PHE-216
GLY-217
12.5
12.4
-18.6
24.6
54.0
55.5
-65.9
GLY-217
ASP-218
10.6
10.1
9.0
-21.5
118.7
122.3
116.6
ASP-218
LEU-219
7.2
6.7
-4.8
8.7
113.7
106.7
10.0
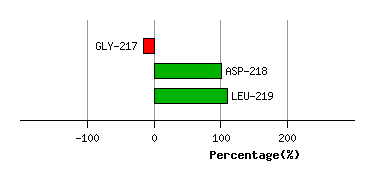
Graph shows rotational transition at bending residues and can be used
to identify hinge bending residues.
Probably only informative for interdomain rotations greater than 20 degrees
Residue
iResidue
i+1Distance of hinge axis to residue i in
(A) Distance of hinge axis to residue i in
(A) Change in
(deg) Change in
(deg) Angle of psi(i) axis to hinge axis
(deg) Angle of psi(i) axis to hinge axis
(deg) Percentage Progress
PHE-222
ARG-223
6.4
6.2
-4.8
6.1
83.0
80.8
-7.7
ARG-223
ARG-224
6.6
6.6
-13.8
18.5
81.8
79.7
-23.4
ARG-224
LEU-225
10.3
10.2
-3.3
-3.8
19.2
18.4
110.4
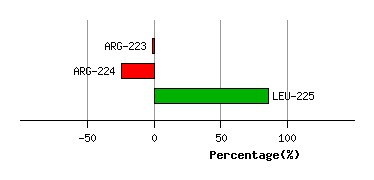
Graph shows rotational transition at bending residues and can be used
to identify hinge bending residues.
Probably only informative for interdomain rotations greater than 20 degrees
Residue
iResidue
i+1Distance of hinge axis to residue i in
(A) Distance of hinge axis to residue i in
(A) Change in
(deg) Change in
(deg) Angle of psi(i) axis to hinge axis
(deg) Angle of psi(i) axis to hinge axis
(deg) Percentage Progress
ILE-237
LEU-238
2.7
2.8
-16.4
14.5
65.1
67.8
4.3
LEU-238
ASP-239
2.8
2.6
0.1
-19.0
56.0
52.1
-136.9
ASP-239
ALA-240
5.9
5.4
-6.3
-19.9
60.7
52.9
210.5
ALA-240
VAL-241
7.4
7.3
32.6
-7.9
72.0
55.7
202.0
VAL-241
PHE-242
11.1
10.9
44.3
-19.4
104.5
110.4
-166.1
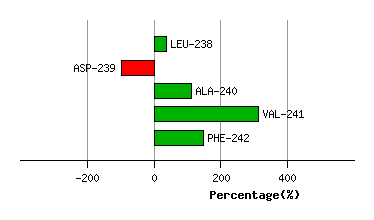
Graph shows rotational transition at bending residues and can be used
to identify hinge bending residues.
Probably only informative for interdomain rotations greater than 20 degrees
Residue
iResidue
i+1Distance of hinge axis to residue i in
(A) Distance of hinge axis to residue i in
(A) Change in
(deg) Change in
(deg) Angle of psi(i) axis to hinge axis
(deg) Angle of psi(i) axis to hinge axis
(deg) Percentage Progress
PHE-308
ASP-309
12.7
12.6
-5.0
4.8
147.7
147.7
30.3
ASP-309
VAL-310
11.9
11.8
1.6
-3.0
88.8
90.2
-4.4
VAL-310
ALA-311
9.1
8.9
-1.4
10.3
58.9
58.7
-53.7
ALA-311
ARG-312
7.7
7.8
-24.1
22.1
116.3
123.4
96.6
ARG-312
PHE-313
9.0
9.1
-5.9
-1.2
132.7
129.8
-47.8
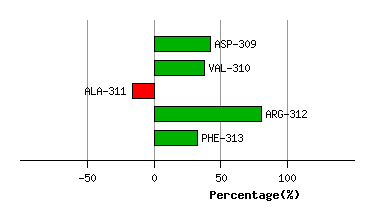
Graph shows rotational transition at bending residues and can be used
to identify hinge bending residues.
Probably only informative for interdomain rotations greater than 20 degrees
Residue
iResidue
i+1Distance of hinge axis to residue i in
(A) Distance of hinge axis to residue i in
(A) Change in
(deg) Change in
(deg) Angle of psi(i) axis to hinge axis
(deg) Angle of psi(i) axis to hinge axis
(deg) Percentage Progress
GLN-317
GLY-318
4.6
4.7
-18.3
14.3
49.2
51.4
52.5
GLY-318
ILE-319
6.8
6.7
13.8
-8.9
150.2
149.5
-78.1
ILE-319
ASP-320
4.5
4.4
0.2
-12.6
142.3
140.5
192.3
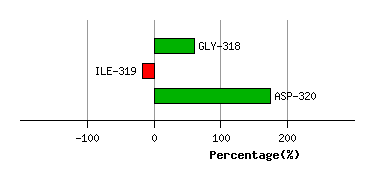
Graph shows rotational transition at bending residues and can be used
to identify hinge bending residues.
Probably only informative for interdomain rotations greater than 20 degrees
Residue
iResidue
i+1Distance of hinge axis to residue i in
(A) Distance of hinge axis to residue i in
(A) Change in
(deg) Change in
(deg) Angle of psi(i) axis to hinge axis
(deg) Angle of psi(i) axis to hinge axis
(deg) Percentage Progress
ARG-323
LEU-324
3.9
3.8
0.0
-18.3
76.6
77.1
40.9
LEU-324
ASN-325
7.4
7.4
8.1
-11.5
71.4
57.3
35.1
ASN-325
VAL-326
10.3
10.5
15.9
4.2
66.1
79.1
109.3
VAL-326
ALA-327
13.1
13.3
2.9
-16.4
84.5
94.1
-53.2
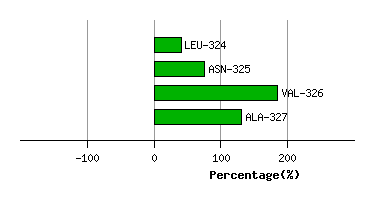
Graph shows rotational transition at bending residues and can be used
to identify hinge bending residues.
Probably only informative for interdomain rotations greater than 20 degrees
Residue
iResidue
i+1Distance of hinge axis to residue i in
(A) Distance of hinge axis to residue i in
(A) Change in
(deg) Change in
(deg) Angle of psi(i) axis to hinge axis
(deg) Angle of psi(i) axis to hinge axis
(deg) Percentage Progress
ALA-349
LEU-350
7.6
7.8
-1.2
-2.5
31.9
31.3
14.2
LEU-350
ILE-351
5.1
5.2
-0.7
-6.2
96.1
97.4
-12.6
ILE-351
VAL-352
4.6
4.7
-6.6
-0.6
37.5
35.8
88.3
VAL-352
GLY-353
2.9
3.0
0.4
-9.0
84.2
82.5
15.2
GLY-353
GLU-354
6.3
6.2
23.4
-18.1
110.7
123.7
-52.8
GLU-354
ILE-355
8.2
8.3
9.1
4.3
126.6
122.9
-111.4
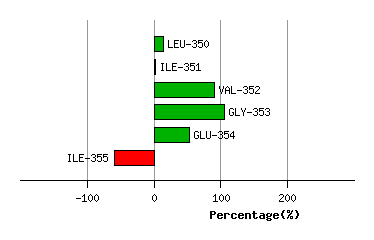
Graph shows rotational transition at bending residues and can be used
to identify hinge bending residues.
Probably only informative for interdomain rotations greater than 20 degrees
Residue
iResidue
i+1Distance of hinge axis to residue i in
(A) Distance of hinge axis to residue i in
(A) Change in
(deg) Change in
(deg) Angle of psi(i) axis to hinge axis
(deg) Angle of psi(i) axis to hinge axis
(deg) Percentage Progress
ASP-369
SER-370
6.2
6.4
-4.3
-5.1
50.5
44.0
59.6
SER-370
VAL-371
3.0
3.4
0.5
7.2
76.2
73.2
75.3
VAL-371
MET-372
3.7
3.7
15.2
-9.0
98.4
100.9
24.4
MET-372
ASN-373
5.4
5.0
5.3
7.1
17.8
10.5
146.0
MET-372
ASN-373
5.4
5.0
5.3
7.1
17.8
10.5
146.0
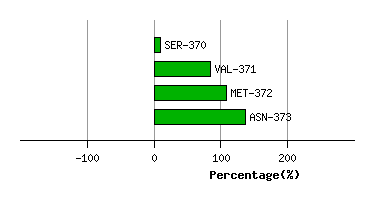
Graph shows rotational transition at bending residues and can be used
to identify hinge bending residues.
Probably only informative for interdomain rotations greater than 20 degrees
Residue
iResidue
i+1Distance of hinge axis to residue i in
(A) Distance of hinge axis to residue i in
(A) Change in
(deg) Change in
(deg) Angle of psi(i) axis to hinge axis
(deg) Angle of psi(i) axis to hinge axis
(deg) Percentage Progress
MET-372
ASN-373
5.4
5.0
5.3
7.1
17.8
10.5
146.0
MET-372
ASN-373
5.4
5.0
5.3
7.1
17.8
10.5
146.0
ASN-373
TYR-374
5.6
4.9
-7.6
5.9
109.4
105.2
29.3
TYR-374
LEU-375
9.3
8.6
-5.9
2.1
174.6
170.1
-66.8
LEU-375
PHE-376
8.5
7.9
1.0
2.3
70.9
77.3
-14.7
PHE-376
ARG-377
7.6
7.6
-11.5
9.7
81.8
80.7
-14.5
ARG-377
GLU-378
11.1
11.0
-11.9
4.7
134.5
137.0
-76.8
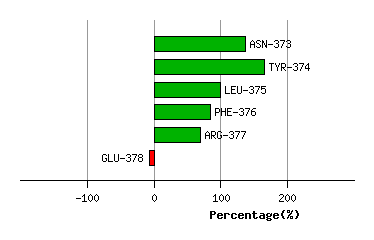
Graph shows rotational transition at bending residues and can be used
to identify hinge bending residues.
Probably only informative for interdomain rotations greater than 20 degrees
Residue
iResidue
i+1Distance of hinge axis to residue i in
(A) Distance of hinge axis to residue i in
(A) Change in
(deg) Change in
(deg) Angle of psi(i) axis to hinge axis
(deg) Angle of psi(i) axis to hinge axis
(deg) Percentage Progress
ARG-400
ALA-401
4.0
3.5
-27.9
22.4
14.4
17.8
54.3
ALA-401
ARG-402
3.9
3.9
-3.9
15.2
74.2
76.0
-31.1
ARG-402
MET-403
1.1
0.7
-12.5
6.9
101.8
95.4
-9.9
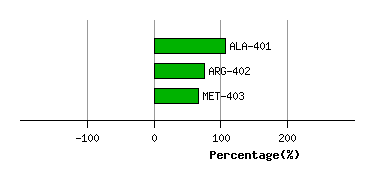
Graph shows rotational transition at bending residues and can be used
to identify hinge bending residues.
Probably only informative for interdomain rotations greater than 20 degrees
Residue
iResidue
i+1Distance of hinge axis to residue i in
(A) Distance of hinge axis to residue i in
(A) Change in
(deg) Change in
(deg) Angle of psi(i) axis to hinge axis
(deg) Angle of psi(i) axis to hinge axis
(deg) Percentage Progress
ALA-410
GLN-411
3.2
3.2
7.2
-13.2
69.1
65.5
11.8
GLN-411
GLY-412
6.0
5.7
5.3
16.9
30.9
22.8
290.4
GLY-412
LEU-413
4.5
4.4
-23.4
9.1
99.9
96.2
-82.2
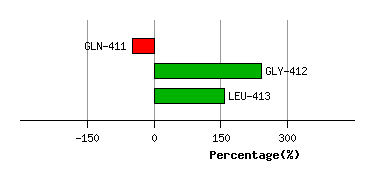
Graph shows rotational transition at bending residues and can be used
to identify hinge bending residues.
Probably only informative for interdomain rotations greater than 20 degrees