3-Deoxy-Manno-Octulosonate Cytidylyltransferase
(All numbering and residues are taken from first PDB file)
![]()
![]()
Bending Residue Dihedral Analysis
Residue
iResidue
i+1Distance of hinge axis to residue i in
(A) Distance of hinge axis to residue i in
(A) Change in
(deg) Change in
(deg) Angle of psi(i) axis to hinge axis
(deg) Angle of psi(i) axis to hinge axis
(deg) Percentage Progress
ASN-71
HIS-72
14.9
15.6
165.7
20.1
132.8
129.5
-642.4
HIS-72
ASN-73
16.3
13.4
165.9
-59.4
129.6
133.2
1461.3
ASN-73
SER-74
13.2
15.3
-155.0
-95.8
9.9
21.8
-663.0
SER-74
GLY-75
12.7
12.9
-10.4
4.2
67.8
86.0
21.5
GLY-75
THR-76
10.6
10.1
4.0
-8.0
80.5
66.3
-39.8
THR-76
GLU-77
7.9
7.8
-18.3
14.2
160.1
176.2
-10.6
GLU-77
ARG-78
8.1
8.9
-4.4
6.5
94.8
106.7
-22.9
ARG-78
LEU-79
8.0
8.7
-6.3
-5.7
66.2
82.0
-11.0
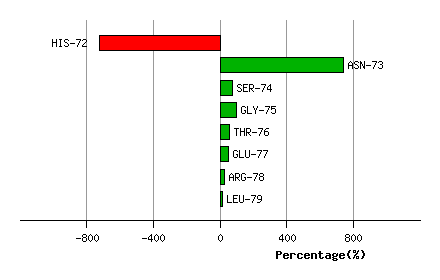
Graph shows rotational transition at bending residues and can be used
to identify hinge bending residues.
Probably only informative for interdomain rotations greater than 20 degrees
Residue
iResidue
i+1Distance of hinge axis to residue i in
(A) Distance of hinge axis to residue i in
(A) Change in
(deg) Change in
(deg) Angle of psi(i) axis to hinge axis
(deg) Angle of psi(i) axis to hinge axis
(deg) Percentage Progress
VAL-107
ILE-108
4.8
5.4
-7.2
18.4
117.7
119.0
40.8
ILE-108
VAL-109
2.6
2.8
-0.2
11.7
167.1
165.7
74.2
VAL-109
ARG-110
3.5
3.5
-14.8
11.8
93.7
93.5
10.5
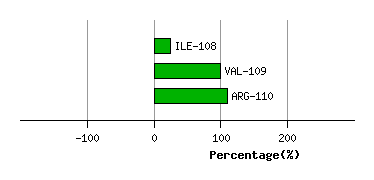
Graph shows rotational transition at bending residues and can be used
to identify hinge bending residues.
Probably only informative for interdomain rotations greater than 20 degrees
Residue
iResidue
i+1Distance of hinge axis to residue i in
(A) Distance of hinge axis to residue i in
(A) Change in
(deg) Change in
(deg) Angle of psi(i) axis to hinge axis
(deg) Angle of psi(i) axis to hinge axis
(deg) Percentage Progress
ILE-188
TYR-189
6.3
6.7
-1.2
2.8
71.0
72.7
24.5
TYR-189
ALA-190
4.3
4.8
7.5
-14.5
104.4
99.7
58.3
ALA-190
TYR-191
2.3
2.5
-16.5
-13.3
44.8
50.4
166.3
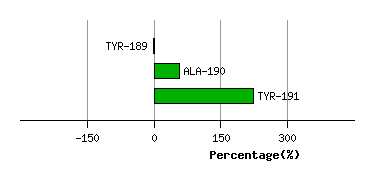
Graph shows rotational transition at bending residues and can be used
to identify hinge bending residues.
Probably only informative for interdomain rotations greater than 20 degrees
Residue
iResidue
i+1Distance of hinge axis to residue i in
(A) Distance of hinge axis to residue i in
(A) Change in
(deg) Change in
(deg) Angle of psi(i) axis to hinge axis
(deg) Angle of psi(i) axis to hinge axis
(deg) Percentage Progress
ARG-192
ALA-193
5.9
4.9
12.8
-0.6
34.3
28.5
71.0
ALA-193
GLY-194
3.9
3.2
6.6
2.1
41.7
50.5
48.7
GLY-194
PHE-195
6.3
6.1
-9.0
1.8
83.9
76.8
29.9
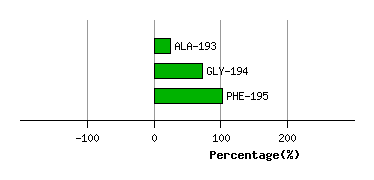
Graph shows rotational transition at bending residues and can be used
to identify hinge bending residues.
Probably only informative for interdomain rotations greater than 20 degrees
Residue
iResidue
i+1Distance of hinge axis to residue i in
(A) Distance of hinge axis to residue i in
(A) Change in
(deg) Change in
(deg) Angle of psi(i) axis to hinge axis
(deg) Angle of psi(i) axis to hinge axis
(deg) Percentage Progress
ALA-230
LYS-231
5.0
4.6
1.1
12.5
27.5
26.9
66.7
LYS-231
GLU-232
2.3
2.1
-16.8
22.3
114.2
114.3
-13.0
GLU-232
VAL-233
5.3
5.5
4.6
-4.6
125.1
119.5
14.7
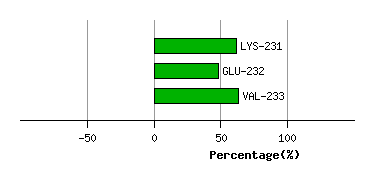
Graph shows rotational transition at bending residues and can be used
to identify hinge bending residues.
Probably only informative for interdomain rotations greater than 20 degrees