Uridine Diphospho-N-Acetylenolpyruvylglucosamine Reductase
(All numbering and residues are taken from first PDB file)
![]()
![]()
Bending Residue Dihedral Analysis
Residue
iResidue
i+1Distance of hinge axis to residue i in
(A) Distance of hinge axis to residue i in
(A) Change in
(deg) Change in
(deg) Angle of psi(i) axis to hinge axis
(deg) Angle of psi(i) axis to hinge axis
(deg) Percentage Progress
GLY-49
SER-50
9.3
9.4
34.9
-27.9
29.2
23.4
6.5
SER-50
ASN-51
8.6
8.6
3.8
4.4
83.2
81.1
38.9
ASN-51
VAL-52
5.8
5.8
-2.2
-0.6
42.5
43.0
-32.8
VAL-52
LEU-53
3.7
3.8
-3.0
-1.9
104.9
98.6
82.0
LEU-53
PHE-54
2.7
3.0
-1.1
7.9
18.1
20.0
-92.1
LEU-53
PHE-54
2.7
3.0
-1.1
7.9
18.1
20.0
-92.1
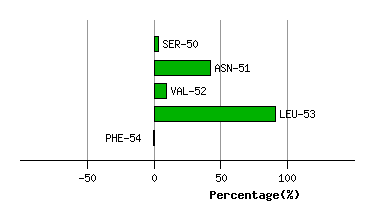
Graph shows rotational transition at bending residues and can be used
to identify hinge bending residues.
Probably only informative for interdomain rotations greater than 20 degrees
Residue
iResidue
i+1Distance of hinge axis to residue i in
(A) Distance of hinge axis to residue i in
(A) Change in
(deg) Change in
(deg) Angle of psi(i) axis to hinge axis
(deg) Angle of psi(i) axis to hinge axis
(deg) Percentage Progress
LEU-53
PHE-54
2.7
3.0
-1.1
7.9
18.1
20.0
-92.1
LEU-53
PHE-54
2.7
3.0
-1.1
7.9
18.1
20.0
-92.1
PHE-54
LEU-55
4.6
4.7
21.8
-11.4
91.4
86.7
-13.6
LEU-55
GLU-56
6.2
6.1
18.0
-48.3
134.9
126.6
244.8
GLU-56
ASP-57
7.8
8.1
-11.6
27.9
103.8
122.1
165.3
GLU-56
ASP-57
7.8
8.1
-11.6
27.9
103.8
122.1
165.3
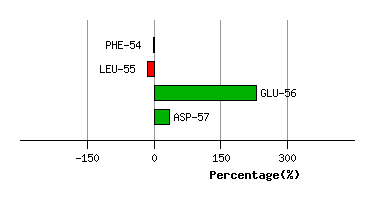
Graph shows rotational transition at bending residues and can be used
to identify hinge bending residues.
Probably only informative for interdomain rotations greater than 20 degrees
Residue
iResidue
i+1Distance of hinge axis to residue i in
(A) Distance of hinge axis to residue i in
(A) Change in
(deg) Change in
(deg) Angle of psi(i) axis to hinge axis
(deg) Angle of psi(i) axis to hinge axis
(deg) Percentage Progress
GLU-56
ASP-57
7.8
8.1
-11.6
27.9
103.8
122.1
165.3
GLU-56
ASP-57
7.8
8.1
-11.6
27.9
103.8
122.1
165.3
ASP-57
TYR-58
8.7
8.7
0.0
-9.5
52.7
62.2
29.6
TYR-58
ARG-59
6.1
5.9
10.5
-7.5
13.3
17.4
56.8
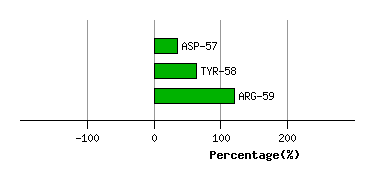
Graph shows rotational transition at bending residues and can be used
to identify hinge bending residues.
Probably only informative for interdomain rotations greater than 20 degrees
Residue
iResidue
i+1Distance of hinge axis to residue i in
(A) Distance of hinge axis to residue i in
(A) Change in
(deg) Change in
(deg) Angle of psi(i) axis to hinge axis
(deg) Angle of psi(i) axis to hinge axis
(deg) Percentage Progress
ARG-214
THR-215
11.1
10.8
4.2
-3.5
88.7
87.3
-52.5
THR-215
THR-216
12.7
11.9
-4.1
14.1
129.0
127.2
101.8
THR-216
LYS-217
10.6
9.4
13.1
-18.4
101.9
113.9
17.6
LYS-217
LEU-218
7.0
6.3
-4.3
-4.3
22.2
22.2
94.7
LEU-218
PRO-219
7.2
7.2
-11.5
-4.7
73.3
76.2
-10.3
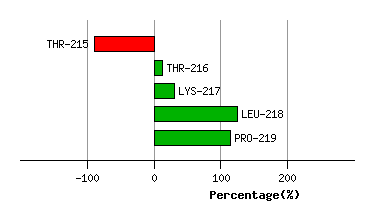
Graph shows rotational transition at bending residues and can be used
to identify hinge bending residues.
Probably only informative for interdomain rotations greater than 20 degrees
Residue
iResidue
i+1Distance of hinge axis to residue i in
(A) Distance of hinge axis to residue i in
(A) Change in
(deg) Change in
(deg) Angle of psi(i) axis to hinge axis
(deg) Angle of psi(i) axis to hinge axis
(deg) Percentage Progress
LYS-275
GLY-276
7.9
7.4
1.9
2.8
86.2
85.7
-18.9
GLY-276
MET-277
10.1
9.9
3.9
-5.6
45.1
49.6
-46.7
MET-277
GLN-278
12.0
11.6
29.4
-38.9
31.6
30.9
-116.8
GLN-278
ILE-279
13.3
12.8
25.5
-11.9
50.4
46.1
145.4
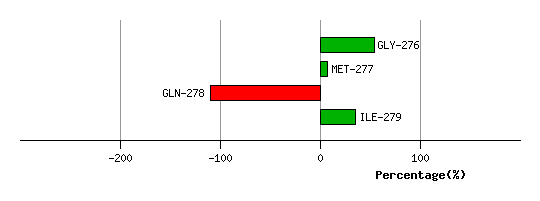
Graph shows rotational transition at bending residues and can be used
to identify hinge bending residues.
Probably only informative for interdomain rotations greater than 20 degrees
Residue
iResidue
i+1Distance of hinge axis to residue i in
(A) Distance of hinge axis to residue i in
(A) Change in
(deg) Change in
(deg) Angle of psi(i) axis to hinge axis
(deg) Angle of psi(i) axis to hinge axis
(deg) Percentage Progress
ALA-282
ALA-283
10.7
10.8
5.8
-6.6
153.8
152.6
59.2
ALA-283
VAL-284
9.6
9.6
13.1
-10.9
110.7
107.1
-79.8
VAL-284
HIS-285
7.0
6.7
2.6
-2.0
133.9
133.7
-20.3
HIS-285
ARG-286
5.6
5.6
0.2
-16.0
155.5
159.3
157.6
ARG-286
GLN-287
6.2
5.9
31.4
-17.6
120.7
121.8
-6.5
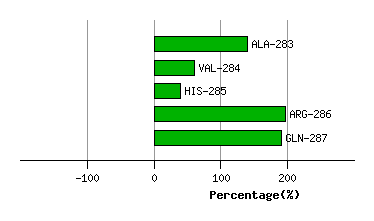
Graph shows rotational transition at bending residues and can be used
to identify hinge bending residues.
Probably only informative for interdomain rotations greater than 20 degrees
Residue
iResidue
i+1Distance of hinge axis to residue i in
(A) Distance of hinge axis to residue i in
(A) Change in
(deg) Change in
(deg) Angle of psi(i) axis to hinge axis
(deg) Angle of psi(i) axis to hinge axis
(deg) Percentage Progress
GLU-323
PRO-324
10.1
9.9
-9.9
14.7
90.5
88.3
56.5
PRO-324
GLU-325
6.4
6.2
4.6
-14.5
75.4
77.0
-15.8
GLU-325
VAL-326
6.2
5.9
16.5
-17.1
44.5
51.0
18.4
VAL-326
ARG-327
3.2
2.9
-6.9
14.3
157.3
160.6
76.4
ARG-327
PHE-328
3.4
3.3
-2.8
-7.4
117.7
112.1
-77.1
PHE-328
ILE-329
2.0
1.8
-4.7
8.8
165.0
167.5
36.7
ILE-329
GLY-330
0.7
0.6
-3.7
1.0
115.8
119.3
10.3
GLY-330
ALA-331
3.6
3.3
3.8
-0.1
40.1
38.7
0.8
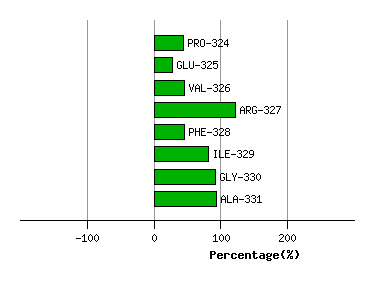
Graph shows rotational transition at bending residues and can be used
to identify hinge bending residues.
Probably only informative for interdomain rotations greater than 20 degrees
Residue
iResidue
i+1Distance of hinge axis to residue i in
(A) Distance of hinge axis to residue i in
(A) Change in
(deg) Change in
(deg) Angle of psi(i) axis to hinge axis
(deg) Angle of psi(i) axis to hinge axis
(deg) Percentage Progress
GLY-333
GLU-334
1.6
1.8
-1.2
13.3
150.3
146.5
157.9
GLU-334
VAL-335
3.6
3.5
-3.5
7.1
91.2
83.2
15.7
VAL-335
SER-336
6.0
5.7
18.4
-17.2
28.9
30.2
-25.0
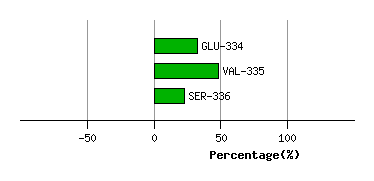
Graph shows rotational transition at bending residues and can be used
to identify hinge bending residues.
Probably only informative for interdomain rotations greater than 20 degrees