Atp-Dependent Molecular Chaperone Hsp82
(All numbering and residues are taken from first PDB file)
![]()
![]()
Bending Residue Dihedral Analysis
Residue
iResidue
i+1Distance of hinge axis to residue i in
(A) Distance of hinge axis to residue i in
(A) Change in
(deg) Change in
(deg) Angle of psi(i) axis to hinge axis
(deg) Angle of psi(i) axis to hinge axis
(deg) Percentage Progress
ASN-91
ASN-92
2.6
3.4
-4.0
11.5
170.4
164.5
14.4
ASN-92
LEU-93
2.7
3.8
28.7
-34.4
53.2
48.6
-13.3
LEU-93
GLY-94
0.8
0.5
5.4
-75.4
103.5
86.0
-13.3
GLY-94
THR-95
3.4
3.2
-4.0
-27.0
119.4
72.9
-28.3
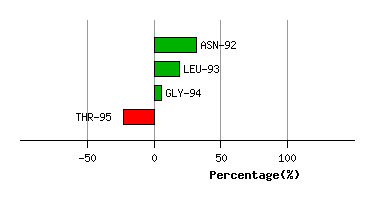
Graph shows rotational transition at bending residues and can be used
to identify hinge bending residues.
Probably only informative for interdomain rotations greater than 20 degrees
Residue
iResidue
i+1Distance of hinge axis to residue i in
(A) Distance of hinge axis to residue i in
(A) Change in
(deg) Change in
(deg) Angle of psi(i) axis to hinge axis
(deg) Angle of psi(i) axis to hinge axis
(deg) Percentage Progress
ASP-113
VAL-114
3.4
3.5
-138.3
75.4
145.5
161.1
-98.6
VAL-114
SER-115
1.5
1.2
123.7
-163.7
78.3
69.7
11.9
SER-115
MET-116
3.3
4.1
-130.7
15.0
170.0
114.3
-130.4
MET-116
ILE-117
4.4
6.2
45.3
62.0
79.8
8.5
146.9
ILE-117
GLY-118
7.7
4.5
144.5
-140.3
147.3
48.5
-3.9
GLY-118
GLN-119
9.8
7.3
159.0
-14.5
100.6
86.8
-36.4
GLN-119
PHE-120
9.8
9.9
-159.8
-161.3
77.7
125.0
38.1
PHE-120
GLY-121
6.9
8.7
-22.8
165.6
120.7
157.1
172.3
GLY-121
VAL-122
5.2
7.9
-137.1
-2.4
135.6
110.4
-129.9
VAL-122
GLY-123
3.3
4.1
11.2
-115.4
33.2
119.4
-28.2
GLY-123
PHE-124
3.3
4.3
112.5
2.7
76.2
62.2
58.9
PHE-124
TYR-125
1.9
4.1
-9.6
-19.1
64.4
71.1
12.3
TYR-125
SER-126
2.2
2.4
25.6
-1.7
141.6
154.0
-25.9
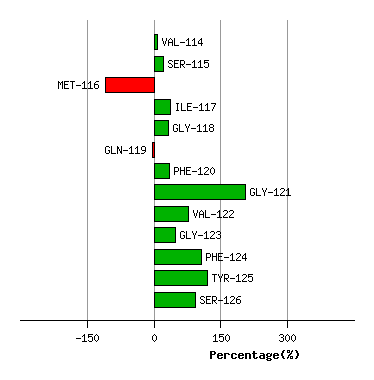
Graph shows rotational transition at bending residues and can be used
to identify hinge bending residues.
Probably only informative for interdomain rotations greater than 20 degrees