Cell Division Protein Ftsy
(All numbering and residues are taken from first PDB file)
![]()
![]()
Bending Residue Dihedral Analysis
Residue
iResidue
i+1Distance of hinge axis to residue i in
(A) Distance of hinge axis to residue i in
(A) Change in
(deg) Change in
(deg) Angle of psi(i) axis to hinge axis
(deg) Angle of psi(i) axis to hinge axis
(deg) Percentage Progress
GLU-77
PRO-78
7.6
6.3
37.3
-16.9
130.6
131.2
-50.3
PRO-78
ASP-79
6.8
6.4
-2.4
18.2
101.1
106.7
27.0
ALA-83
THR-84
16.1
13.9
37.7
4.7
74.9
130.2
-19.2
THR-84
LEU-85
19.1
16.3
3.7
8.3
80.5
69.0
47.8
LEU-85
ARG-86
17.3
19.1
-13.1
-4.0
29.6
83.9
38.8
ARG-86
LYS-87
16.6
19.2
20.5
-14.8
109.7
161.6
-23.5
LYS-87
LEU-88
20.3
19.2
13.5
-16.0
59.1
105.9
-34.2
LEU-88
GLY-89
21.4
22.3
63.4
-18.3
97.5
62.2
77.1
GLY-89
PHE-90
19.4
24.4
32.8
42.3
34.4
23.7
358.3
PHE-90
ASN-91
19.0
23.7
22.3
-61.7
50.7
51.7
-96.8
ASN-91
PRO-92
17.8
22.1
-70.7
-3.4
136.9
145.9
-278.8
PRO-92
GLN-93
20.8
21.0
138.3
-43.0
20.3
64.0
330.5
GLN-93
LYS-94
18.5
18.5
-175.4
-88.5
100.7
148.3
-1091.5
VAL-98
GLU-99
7.8
7.6
14.0
18.6
46.8
57.3
77.1
GLU-99
PRO-100
8.8
9.3
-9.7
-5.4
59.3
58.8
31.8
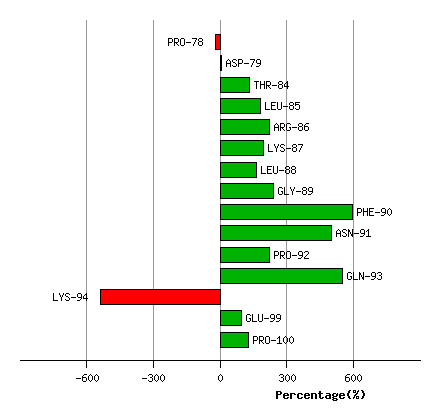
Graph shows rotational transition at bending residues and can be used
to identify hinge bending residues.
Probably only informative for interdomain rotations greater than 20 degrees
Residue
iResidue
i+1Distance of hinge axis to residue i in
(A) Distance of hinge axis to residue i in
(A) Change in
(deg) Change in
(deg) Angle of psi(i) axis to hinge axis
(deg) Angle of psi(i) axis to hinge axis
(deg) Percentage Progress
ALA-230
VAL-231
11.5
12.1
35.4
-43.2
59.0
59.0
-32.7
VAL-231
THR-232
15.3
15.7
53.4
10.3
42.2
38.5
216.0
THR-232
GLY-233
14.9
14.9
86.6
-8.1
60.5
24.5
246.0
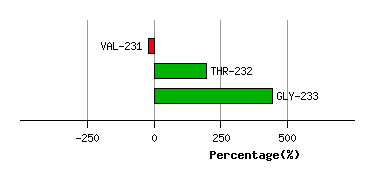
Graph shows rotational transition at bending residues and can be used
to identify hinge bending residues.
Probably only informative for interdomain rotations greater than 20 degrees
Residue
iResidue
i+1Distance of hinge axis to residue i in
(A) Distance of hinge axis to residue i in
(A) Change in
(deg) Change in
(deg) Angle of psi(i) axis to hinge axis
(deg) Angle of psi(i) axis to hinge axis
(deg) Percentage Progress
LEU-237
GLU-238
10.1
9.7
-20.6
-3.9
60.2
84.6
9.1
GLU-238
GLN-239
12.7
12.7
16.6
1.3
52.9
32.8
79.1
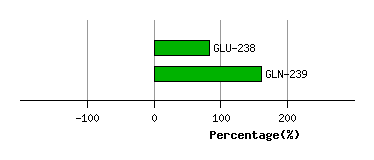
Graph shows rotational transition at bending residues and can be used
to identify hinge bending residues.
Probably only informative for interdomain rotations greater than 20 degrees
Residue
iResidue
i+1Distance of hinge axis to residue i in
(A) Distance of hinge axis to residue i in
(A) Change in
(deg) Change in
(deg) Angle of psi(i) axis to hinge axis
(deg) Angle of psi(i) axis to hinge axis
(deg) Percentage Progress
GLY-259
THR-260
17.1
17.4
-9.2
1.7
136.8
145.0
-54.5
THR-260
ALA-261
19.2
19.1
4.6
-8.5
36.4
35.8
1.5
ALA-261
LYS-262
16.2
16.6
17.4
-21.9
98.0
86.7
46.0
LYS-262
GLY-263
16.0
14.2
-171.8
143.7
90.8
96.6
-4.3
GLY-263
GLY-264
12.9
11.2
44.0
3.0
33.6
28.0
186.5
GLY-264
VAL-265
12.3
11.0
-4.3
-8.0
109.0
118.8
-17.1
VAL-265
LEU-266
10.4
9.5
7.0
0.6
98.0
97.8
22.7
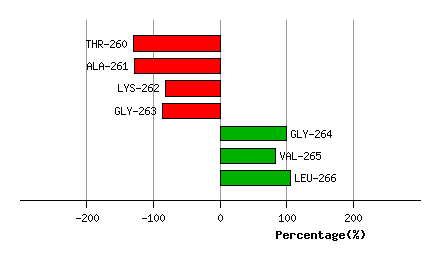
Graph shows rotational transition at bending residues and can be used
to identify hinge bending residues.
Probably only informative for interdomain rotations greater than 20 degrees
Residue
iResidue
i+1Distance of hinge axis to residue i in
(A) Distance of hinge axis to residue i in
(A) Change in
(deg) Change in
(deg) Angle of psi(i) axis to hinge axis
(deg) Angle of psi(i) axis to hinge axis
(deg) Percentage Progress
VAL-270
ARG-271
1.5
0.7
0.2
-11.7
164.3
156.5
44.6
ARG-271
THR-272
1.8
1.0
5.9
-10.2
103.7
116.3
-12.6
THR-272
LEU-273
3.5
2.8
2.6
-10.1
61.3
59.8
-27.7
LEU-273
LYS-274
3.9
4.6
12.1
-3.4
91.8
64.8
30.5
LYS-274
VAL-275
3.3
3.8
0.8
35.3
32.6
17.9
185.6
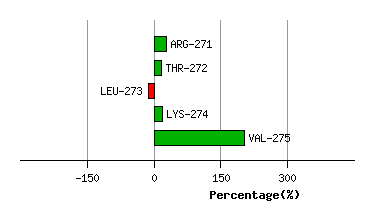
Graph shows rotational transition at bending residues and can be used
to identify hinge bending residues.
Probably only informative for interdomain rotations greater than 20 degrees
Residue
iResidue
i+1Distance of hinge axis to residue i in
(A) Distance of hinge axis to residue i in
(A) Change in
(deg) Change in
(deg) Angle of psi(i) axis to hinge axis
(deg) Angle of psi(i) axis to hinge axis
(deg) Percentage Progress
LEU-289
GLN-290
5.5
5.7
9.9
-14.9
82.4
77.8
-25.7
GLN-290
PRO-291
6.5
6.7
13.3
-1.9
47.4
39.7
36.1
PRO-291
PHE-292
5.7
6.2
10.8
11.7
36.5
35.1
80.5
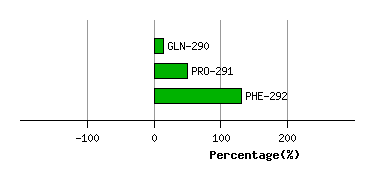
Graph shows rotational transition at bending residues and can be used
to identify hinge bending residues.
Probably only informative for interdomain rotations greater than 20 degrees