Importin Alpha Subunit
(All numbering and residues are taken from first PDB file)
![]()
![]()
Bending Residue Dihedral Analysis
Residue
iResidue
i+1Distance of hinge axis to residue i in
(A) Distance of hinge axis to residue i in
(A) Change in
(deg) Change in
(deg) Angle of psi(i) axis to hinge axis
(deg) Angle of psi(i) axis to hinge axis
(deg) Percentage Progress
CYS-243
ARG-244
3.5
3.5
1.7
3.0
57.0
57.5
65.1
ARG-244
GLY-245
2.0
1.9
5.4
-9.6
11.2
9.7
-55.9
GLY-245
LYS-246
2.4
2.4
5.4
-19.8
58.2
57.6
-121.7
LYS-246
LYS-247
1.5
1.4
5.3
84.7
22.3
12.9
1144.0
LYS-247
PRO-248
1.2
1.9
154.6
0.8
84.1
83.6
-1452.5
LYS-247
PRO-248
1.2
1.9
154.6
0.8
84.1
83.6
-1452.5
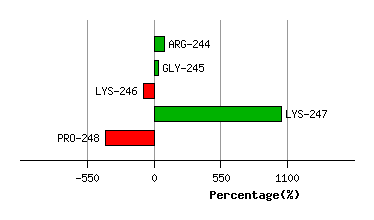
Graph shows rotational transition at bending residues and can be used
to identify hinge bending residues.
Probably only informative for interdomain rotations greater than 20 degrees
Residue
iResidue
i+1Distance of hinge axis to residue i in
(A) Distance of hinge axis to residue i in
(A) Change in
(deg) Change in
(deg) Angle of psi(i) axis to hinge axis
(deg) Angle of psi(i) axis to hinge axis
(deg) Percentage Progress
LYS-247
PRO-248
1.2
1.9
154.6
0.8
84.1
83.6
-1452.5
LYS-247
PRO-248
1.2
1.9
154.6
0.8
84.1
83.6
-1452.5
PRO-248
GLN-249
2.8
3.0
-48.2
8.2
25.3
33.1
531.5
GLN-249
PRO-250
3.2
3.3
-14.8
7.9
74.0
74.6
-17.3
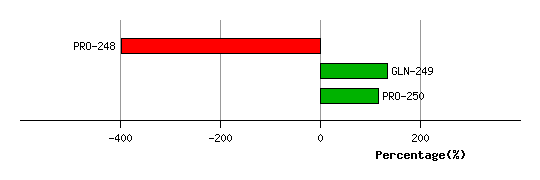
Graph shows rotational transition at bending residues and can be used
to identify hinge bending residues.
Probably only informative for interdomain rotations greater than 20 degrees
Residue
iResidue
i+1Distance of hinge axis to residue i in
(A) Distance of hinge axis to residue i in
(A) Change in
(deg) Change in
(deg) Angle of psi(i) axis to hinge axis
(deg) Angle of psi(i) axis to hinge axis
(deg) Percentage Progress
SER-253
VAL-254
13.7
13.9
15.5
-5.8
35.9
45.0
140.3
VAL-254
VAL-255
12.8
12.7
1.1
-11.1
43.6
41.8
-75.7
VAL-255
SER-256
9.5
9.5
4.8
0.5
64.0
63.0
21.6
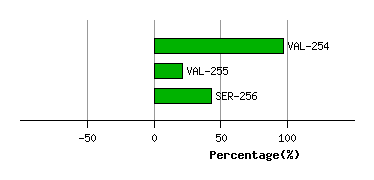
Graph shows rotational transition at bending residues and can be used
to identify hinge bending residues.
Probably only informative for interdomain rotations greater than 20 degrees
Residue
iResidue
i+1Distance of hinge axis to residue i in
(A) Distance of hinge axis to residue i in
(A) Change in
(deg) Change in
(deg) Angle of psi(i) axis to hinge axis
(deg) Angle of psi(i) axis to hinge axis
(deg) Percentage Progress
LEU-259
PRO-260
10.9
10.7
-2.7
1.0
23.7
24.4
16.6
PRO-260
THR-261
13.2
13.1
-9.1
8.4
46.5
44.0
7.6
THR-261
LEU-262
10.6
10.6
-12.4
11.2
85.0
81.6
22.8
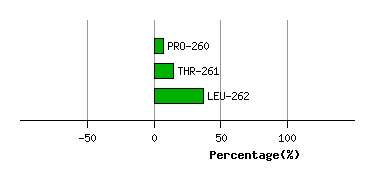
Graph shows rotational transition at bending residues and can be used
to identify hinge bending residues.
Probably only informative for interdomain rotations greater than 20 degrees
Residue
iResidue
i+1Distance of hinge axis to residue i in
(A) Distance of hinge axis to residue i in
(A) Change in
(deg) Change in
(deg) Angle of psi(i) axis to hinge axis
(deg) Angle of psi(i) axis to hinge axis
(deg) Percentage Progress
SER-268
MET-269
4.6
4.5
-14.8
31.7
109.2
117.1
77.9
MET-269
ASP-270
4.1
3.6
-19.9
2.7
87.7
75.4
-15.6
ASP-270
THR-271
1.8
1.5
-5.5
6.1
35.1
37.0
-50.2
THR-271
GLU-272
4.9
4.7
-3.8
-2.0
37.1
31.7
80.9
GLU-272
THR-273
4.7
4.8
-2.5
6.7
59.8
59.2
-40.0
THR-273
LEU-274
1.2
1.4
0.5
-2.2
122.4
118.8
6.5
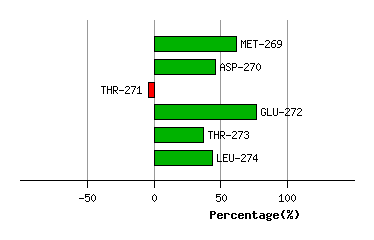
Graph shows rotational transition at bending residues and can be used
to identify hinge bending residues.
Probably only informative for interdomain rotations greater than 20 degrees