Mitochondrial Rna-Binding Protein 1
(All numbering and residues are taken from first PDB file)
![]()
![]()
Bending Residue Dihedral Analysis
Residue
iResidue
i+1Distance of hinge axis to residue i in
(A) Distance of hinge axis to residue i in
(A) Change in
(deg) Change in
(deg) Angle of psi(i) axis to hinge axis
(deg) Angle of psi(i) axis to hinge axis
(deg) Percentage Progress
ASP-36
VAL-37
4.7
5.1
11.1
-5.2
131.1
123.9
-21.9
VAL-37
ARG-38
3.2
2.9
35.9
-20.4
141.7
141.6
-84.5
ARG-38
ASP-39
2.5
2.1
-20.7
-15.1
45.5
46.5
141.8
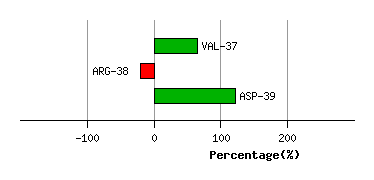
Graph shows rotational transition at bending residues and can be used
to identify hinge bending residues.
Probably only informative for interdomain rotations greater than 20 degrees
Residue
iResidue
i+1Distance of hinge axis to residue i in
(A) Distance of hinge axis to residue i in
(A) Change in
(deg) Change in
(deg) Angle of psi(i) axis to hinge axis
(deg) Angle of psi(i) axis to hinge axis
(deg) Percentage Progress
GLU-43
GLY-44
5.9
6.0
-8.7
-14.7
86.1
65.2
30.9
GLY-44
THR-45
2.7
2.5
21.2
-28.2
145.7
166.6
68.1
THR-47
ARG-48
4.1
4.3
-13.2
20.9
64.4
58.1
-26.2
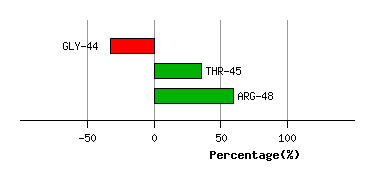
Graph shows rotational transition at bending residues and can be used
to identify hinge bending residues.
Probably only informative for interdomain rotations greater than 20 degrees
Residue
iResidue
i+1Distance of hinge axis to residue i in
(A) Distance of hinge axis to residue i in
(A) Change in
(deg) Change in
(deg) Angle of psi(i) axis to hinge axis
(deg) Angle of psi(i) axis to hinge axis
(deg) Percentage Progress
GLN-60
TYR-61
0.7
1.0
16.4
-10.9
110.1
111.7
9.3
TYR-61
PRO-62
2.6
2.2
24.0
-28.7
160.4
155.0
20.7
PRO-62
GLN-63
3.9
3.7
6.7
-12.5
139.2
132.6
54.0
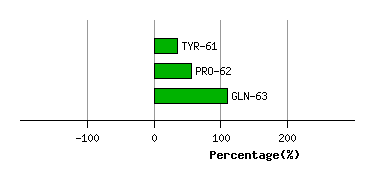
Graph shows rotational transition at bending residues and can be used
to identify hinge bending residues.
Probably only informative for interdomain rotations greater than 20 degrees
Residue
iResidue
i+1Distance of hinge axis to residue i in
(A) Distance of hinge axis to residue i in
(A) Change in
(deg) Change in
(deg) Angle of psi(i) axis to hinge axis
(deg) Angle of psi(i) axis to hinge axis
(deg) Percentage Progress
PRO-76
GLN-77
11.5
10.6
32.8
6.6
56.1
57.5
141.5
GLN-77
PHE-78
8.2
7.3
-9.0
2.9
59.8
59.3
23.1
PHE-78
ASP-79
6.3
5.5
32.2
-29.8
130.3
126.0
-0.1
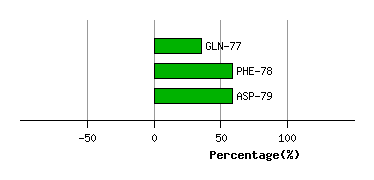
Graph shows rotational transition at bending residues and can be used
to identify hinge bending residues.
Probably only informative for interdomain rotations greater than 20 degrees