Cytochrome F
(All numbering and residues are taken from first PDB file)
![]()
![]()
Bending Residue Dihedral Analysis
Residue
iResidue
i+1Distance of hinge axis to residue i in
(A) Distance of hinge axis to residue i in
(A) Change in
(deg) Change in
(deg) Angle of psi(i) axis to hinge axis
(deg) Angle of psi(i) axis to hinge axis
(deg) Percentage Progress
GLN-56
VAL-57
11.1
10.6
-11.9
20.4
93.8
89.0
17.1
VAL-57
LYS-58
7.4
7.2
-7.8
6.8
78.6
84.0
27.8
LYS-58
GLN-59
5.8
5.4
-11.9
6.4
62.2
56.9
24.7
GLN-59
VAL-60
3.8
3.8
9.5
5.3
61.2
61.7
50.5
VAL-60
LEU-61
4.7
4.7
-13.6
4.8
56.5
70.0
38.7
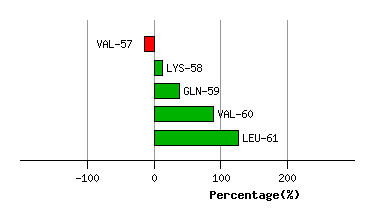
Graph shows rotational transition at bending residues and can be used
to identify hinge bending residues.
Probably only informative for interdomain rotations greater than 20 degrees
Residue
iResidue
i+1Distance of hinge axis to residue i in
(A) Distance of hinge axis to residue i in
(A) Change in
(deg) Change in
(deg) Angle of psi(i) axis to hinge axis
(deg) Angle of psi(i) axis to hinge axis
(deg) Percentage Progress
ALA-62
ASN-63
11.1
11.4
-4.5
15.1
32.9
31.0
-94.3
ASN-63
GLY-64
12.0
12.3
-10.3
15.2
58.7
65.0
-21.4
GLY-64
LYS-65
8.7
9.3
-13.9
2.9
54.1
60.0
60.1
LYS-65
LYS-66
7.8
7.3
11.1
-8.0
55.8
50.7
49.6
LYS-66
GLY-67
5.9
5.1
-4.0
-10.7
100.5
89.7
30.2
GLY-67
ASP-68
8.5
7.8
19.1
9.3
50.7
37.0
251.6
ASP-68
LEU-69
10.0
10.0
-8.8
-7.9
161.3
153.0
-162.9
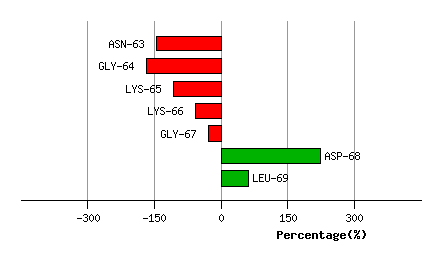
Graph shows rotational transition at bending residues and can be used
to identify hinge bending residues.
Probably only informative for interdomain rotations greater than 20 degrees
Residue
iResidue
i+1Distance of hinge axis to residue i in
(A) Distance of hinge axis to residue i in
(A) Change in
(deg) Change in
(deg) Angle of psi(i) axis to hinge axis
(deg) Angle of psi(i) axis to hinge axis
(deg) Percentage Progress
SER-166
ASN-167
10.9
11.0
2.2
-4.0
48.8
44.9
-22.2
ASN-167
PHE-168
9.8
9.8
-2.3
-7.5
87.0
88.4
73.1
PHE-168
THR-169
6.2
6.2
9.4
-4.2
131.6
138.7
-24.9
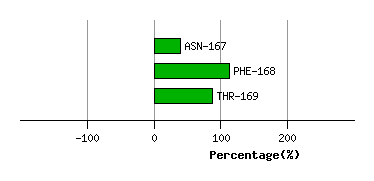
Graph shows rotational transition at bending residues and can be used
to identify hinge bending residues.
Probably only informative for interdomain rotations greater than 20 degrees
Residue
iResidue
i+1Distance of hinge axis to residue i in
(A) Distance of hinge axis to residue i in
(A) Change in
(deg) Change in
(deg) Angle of psi(i) axis to hinge axis
(deg) Angle of psi(i) axis to hinge axis
(deg) Percentage Progress
PRO-232
ASN-233
3.5
3.7
-6.7
2.7
122.6
121.2
-5.3
ASN-233
VAL-234
1.2
1.4
3.7
2.4
96.7
91.2
22.2
VAL-234
GLY-235
2.9
2.6
-8.8
9.2
127.9
131.0
-10.9
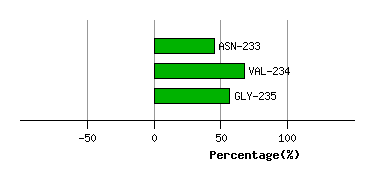
Graph shows rotational transition at bending residues and can be used
to identify hinge bending residues.
Probably only informative for interdomain rotations greater than 20 degrees