Homoserine Kinase
(All numbering and residues are taken from first PDB file)
![]()
![]()
Bending Residue Dihedral Analysis
Residue
iResidue
i+1Distance of hinge axis to residue i in
(A) Distance of hinge axis to residue i in
(A) Change in
(deg) Change in
(deg) Angle of psi(i) axis to hinge axis
(deg) Angle of psi(i) axis to hinge axis
(deg) Percentage Progress
ALA-11
PRO-12
9.9
10.0
-8.9
9.9
89.3
91.0
-42.9
PRO-12
CYS-13
6.3
6.3
-4.0
6.2
86.5
86.8
-27.4
CYS-13
THR-14
4.5
4.7
1.9
0.6
164.5
164.5
-4.1
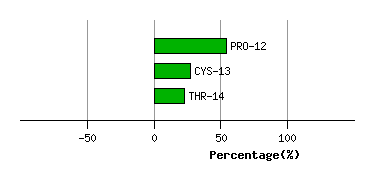
Graph shows rotational transition at bending residues and can be used
to identify hinge bending residues.
Probably only informative for interdomain rotations greater than 20 degrees
Residue
iResidue
i+1Distance of hinge axis to residue i in
(A) Distance of hinge axis to residue i in
(A) Change in
(deg) Change in
(deg) Angle of psi(i) axis to hinge axis
(deg) Angle of psi(i) axis to hinge axis
(deg) Percentage Progress
GLU-31
PRO-32
3.3
3.2
-7.3
-13.2
83.7
84.6
188.9
PRO-32
TYR-33
2.0
1.9
5.6
-2.5
71.4
73.0
15.7
TYR-33
ASP-34
5.5
5.5
5.5
-2.7
142.0
144.2
-36.1
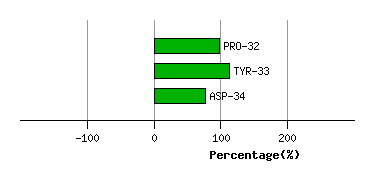
Graph shows rotational transition at bending residues and can be used
to identify hinge bending residues.
Probably only informative for interdomain rotations greater than 20 degrees
Residue
iResidue
i+1Distance of hinge axis to residue i in
(A) Distance of hinge axis to residue i in
(A) Change in
(deg) Change in
(deg) Angle of psi(i) axis to hinge axis
(deg) Angle of psi(i) axis to hinge axis
(deg) Percentage Progress
ILE-85
LYS-86
13.3
13.3
1.5
6.9
63.8
61.0
111.8
LYS-86
LYS-87
9.8
9.9
14.2
-17.0
130.1
131.8
57.1
LYS-87
GLY-88
7.4
7.6
1.1
-4.0
104.2
105.1
-32.7
GLY-88
VAL-89
4.4
4.5
7.0
-8.6
77.0
81.9
-8.9
VAL-89
LYS-90
4.1
4.4
-10.6
9.3
108.6
101.8
16.7
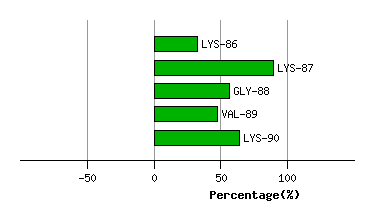
Graph shows rotational transition at bending residues and can be used
to identify hinge bending residues.
Probably only informative for interdomain rotations greater than 20 degrees
Residue
iResidue
i+1Distance of hinge axis to residue i in
(A) Distance of hinge axis to residue i in
(A) Change in
(deg) Change in
(deg) Angle of psi(i) axis to hinge axis
(deg) Angle of psi(i) axis to hinge axis
(deg) Percentage Progress
LEU-95
GLY-96
6.8
7.1
2.3
-3.8
100.0
99.8
-10.2
GLY-96
SER-97
8.9
9.1
15.1
-14.9
41.9
42.3
6.2
SER-97
SER-98
8.7
9.1
3.7
-8.5
92.0
89.2
25.9
SER-98
ALA-99
12.4
12.7
3.6
8.3
138.7
142.7
-115.2
ALA-99
ALA-100
12.3
12.3
-13.1
4.5
98.6
98.7
31.2
ALA-100
SER-101
10.1
10.3
1.5
-1.7
63.4
63.0
-23.4
SER-101
SER-102
13.1
13.2
2.4
-3.9
125.8
125.1
43.0
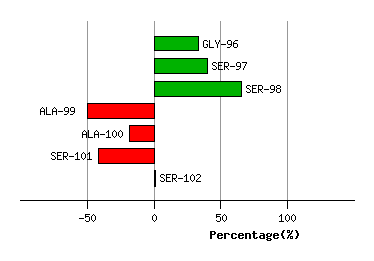
Graph shows rotational transition at bending residues and can be used
to identify hinge bending residues.
Probably only informative for interdomain rotations greater than 20 degrees
Residue
iResidue
i+1Distance of hinge axis to residue i in
(A) Distance of hinge axis to residue i in
(A) Change in
(deg) Change in
(deg) Angle of psi(i) axis to hinge axis
(deg) Angle of psi(i) axis to hinge axis
(deg) Percentage Progress
ASP-118
LYS-119
20.4
20.2
26.6
-12.2
58.6
59.5
34.1
LYS-119
LEU-120
16.8
16.7
-1.0
8.2
89.0
86.2
-23.0
LEU-120
LYS-121
17.2
17.4
0.5
-5.3
54.8
51.4
-31.5
LYS-121
LEU-122
20.6
20.6
7.6
-7.6
17.9
16.3
19.9
LEU-122
VAL-123
18.9
18.8
-3.4
3.5
99.5
100.1
-40.4
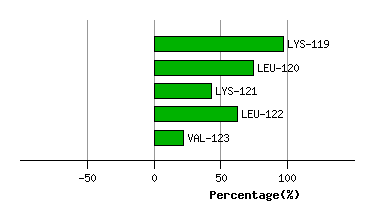
Graph shows rotational transition at bending residues and can be used
to identify hinge bending residues.
Probably only informative for interdomain rotations greater than 20 degrees
Residue
iResidue
i+1Distance of hinge axis to residue i in
(A) Distance of hinge axis to residue i in
(A) Change in
(deg) Change in
(deg) Angle of psi(i) axis to hinge axis
(deg) Angle of psi(i) axis to hinge axis
(deg) Percentage Progress
ASP-140
ASN-141
12.0
12.1
-1.0
5.8
130.7
134.3
26.0
ASN-141
VAL-142
10.3
10.5
-4.3
4.3
93.4
91.8
117.6
VAL-142
ALA-143
12.1
12.3
-1.0
7.9
37.2
36.9
-119.5
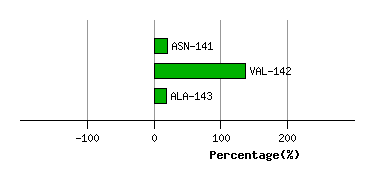
Graph shows rotational transition at bending residues and can be used
to identify hinge bending residues.
Probably only informative for interdomain rotations greater than 20 degrees
Residue
iResidue
i+1Distance of hinge axis to residue i in
(A) Distance of hinge axis to residue i in
(A) Change in
(deg) Change in
(deg) Angle of psi(i) axis to hinge axis
(deg) Angle of psi(i) axis to hinge axis
(deg) Percentage Progress
PRO-144
ALA-145
7.7
7.7
6.8
-9.7
136.2
139.1
-22.7
ALA-145
ILE-146
8.8
8.8
11.8
-7.1
69.0
73.1
-2.1
ILE-146
PHE-147
11.6
11.7
-0.1
-3.7
137.4
136.2
-55.7
PHE-147
GLY-148
10.1
10.2
2.2
0.8
96.3
97.3
-23.2
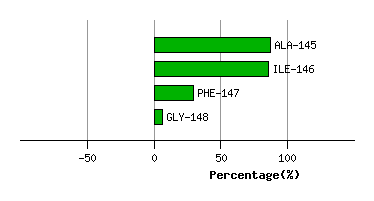
Graph shows rotational transition at bending residues and can be used
to identify hinge bending residues.
Probably only informative for interdomain rotations greater than 20 degrees