Acetolactate Synthase, Catabolic
(All numbering and residues are taken from first PDB file)
![]()
![]()
Bending Residue Dihedral Analysis
Residue
iResidue
i+1Distance of hinge axis to residue i in
(A) Distance of hinge axis to residue i in
(A) Change in
(deg) Change in
(deg) Angle of psi(i) axis to hinge axis
(deg) Angle of psi(i) axis to hinge axis
(deg) Percentage Progress
GLN-188
MET-189
9.7
10.4
-23.3
16.4
90.7
92.1
29.8
ALA-191
ALA-192
10.3
9.9
2.6
33.9
76.5
69.8
103.8
ALA-192
PRO-193
9.9
9.6
-5.1
-6.7
116.4
121.1
-48.7
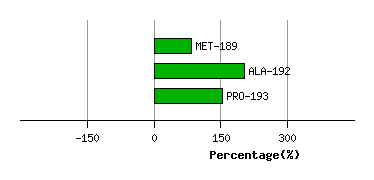
Graph shows rotational transition at bending residues and can be used
to identify hinge bending residues.
Probably only informative for interdomain rotations greater than 20 degrees
Residue
iResidue
i+1Distance of hinge axis to residue i in
(A) Distance of hinge axis to residue i in
(A) Change in
(deg) Change in
(deg) Angle of psi(i) axis to hinge axis
(deg) Angle of psi(i) axis to hinge axis
(deg) Percentage Progress
ALA-257
GLY-258
5.8
5.8
-5.1
3.1
95.6
98.8
-10.0
GLY-258
ARG-259
2.1
2.0
-11.1
2.3
37.8
35.1
73.1
ARG-259
VAL-260
1.2
1.1
6.9
0.8
81.0
80.0
-30.5
VAL-260
GLY-261
4.6
4.6
0.7
-2.7
63.4
64.4
-1.6
VAL-260
GLY-261
4.6
4.6
0.7
-2.7
63.4
64.4
-1.6
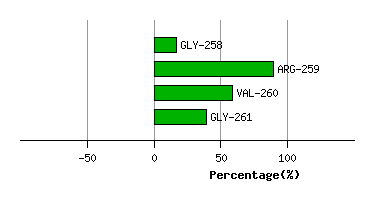
Graph shows rotational transition at bending residues and can be used
to identify hinge bending residues.
Probably only informative for interdomain rotations greater than 20 degrees
Residue
iResidue
i+1Distance of hinge axis to residue i in
(A) Distance of hinge axis to residue i in
(A) Change in
(deg) Change in
(deg) Angle of psi(i) axis to hinge axis
(deg) Angle of psi(i) axis to hinge axis
(deg) Percentage Progress
VAL-260
GLY-261
4.6
4.6
0.7
-2.7
63.4
64.4
-1.6
VAL-260
GLY-261
4.6
4.6
0.7
-2.7
63.4
64.4
-1.6
GLY-261
LEU-262
7.8
7.8
9.0
-10.3
132.7
132.1
13.0
LEU-262
PHE-263
8.8
8.8
2.8
-4.3
147.5
151.4
21.3
PHE-263
ASN-264
8.0
7.8
-5.7
2.4
96.0
97.2
-38.0
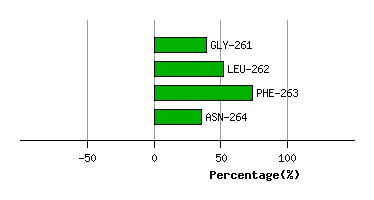
Graph shows rotational transition at bending residues and can be used
to identify hinge bending residues.
Probably only informative for interdomain rotations greater than 20 degrees
Residue
iResidue
i+1Distance of hinge axis to residue i in
(A) Distance of hinge axis to residue i in
(A) Change in
(deg) Change in
(deg) Angle of psi(i) axis to hinge axis
(deg) Angle of psi(i) axis to hinge axis
(deg) Percentage Progress
GLN-266
ALA-267
5.8
5.9
-1.7
-3.5
103.6
103.0
28.6
ALA-267
GLY-268
7.2
7.4
8.2
-7.1
12.4
9.2
3.3
GLY-268
ASP-269
6.6
6.7
0.9
3.0
75.6
74.1
11.7
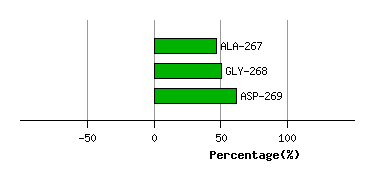
Graph shows rotational transition at bending residues and can be used
to identify hinge bending residues.
Probably only informative for interdomain rotations greater than 20 degrees
Residue
iResidue
i+1Distance of hinge axis to residue i in
(A) Distance of hinge axis to residue i in
(A) Change in
(deg) Change in
(deg) Angle of psi(i) axis to hinge axis
(deg) Angle of psi(i) axis to hinge axis
(deg) Percentage Progress
GLU-347
ILE-348
14.8
15.3
-4.3
-3.3
81.7
83.6
0.7
ILE-348
LEU-349
11.9
12.2
-0.9
0.8
91.8
94.7
18.7
LEU-349
ARG-350
10.6
10.8
3.5
0.3
20.1
16.7
68.1
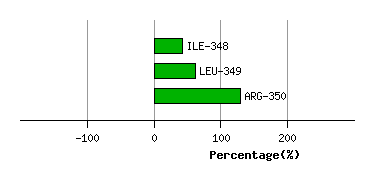
Graph shows rotational transition at bending residues and can be used
to identify hinge bending residues.
Probably only informative for interdomain rotations greater than 20 degrees