Isocitrate Dehydrogenase [Nadp] Cytoplasmic
(All numbering and residues are taken from first PDB file)
![]()
![]()
Bending Residue Dihedral Analysis
Residue
iResidue
i+1Distance of hinge axis to residue i in
(A) Distance of hinge axis to residue i in
(A) Change in
(deg) Change in
(deg) Angle of psi(i) axis to hinge axis
(deg) Angle of psi(i) axis to hinge axis
(deg) Percentage Progress
ILE-117
PRO-118
2.9
2.4
-1.7
-20.8
113.3
99.6
-6.5
PRO-118
ARG-119
3.6
3.3
9.9
19.0
14.5
39.8
80.3
ARG-119
LEU-120
5.3
5.0
3.7
-32.9
91.1
108.9
-2.7
LEU-120
VAL-121
7.9
7.9
5.9
27.4
104.4
72.2
4.6
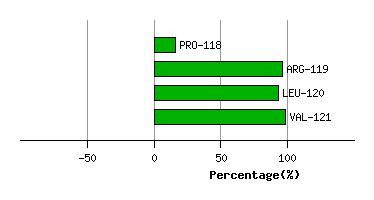
Graph shows rotational transition at bending residues and can be used
to identify hinge bending residues.
Probably only informative for interdomain rotations greater than 20 degrees
Residue
iResidue
i+1Distance of hinge axis to residue i in
(A) Distance of hinge axis to residue i in
(A) Change in
(deg) Change in
(deg) Angle of psi(i) axis to hinge axis
(deg) Angle of psi(i) axis to hinge axis
(deg) Percentage Progress
ARG-132
HIS-133
6.1
4.7
-17.2
12.7
21.9
19.6
16.2
HIS-133
ALA-134
6.9
5.4
-8.4
67.7
92.3
91.5
16.9
ALA-134
TYR-135
8.3
6.1
-139.7
-45.5
40.7
42.1
408.7
TYR-135
GLY-136
9.8
8.2
-13.8
140.0
116.7
84.3
-34.6
GLY-136
ASP-137
10.5
11.6
27.3
127.0
77.1
45.3
-276.8
ASP-137
GLN-138
14.0
14.3
-128.5
20.8
33.7
111.4
173.6
GLN-138
TYR-139
15.0
16.5
-16.1
-4.1
69.9
91.2
91.0
TYR-139
ARG-140
14.9
14.8
-124.5
-39.6
107.5
31.0
-438.3
ARG-140
ALA-141
18.5
15.6
-84.0
-35.5
90.0
65.6
59.0
ALA-141
THR-142
19.9
18.8
30.7
-17.9
131.4
105.8
-9.9
THR-142
ASP-143
22.2
22.3
39.2
-0.6
65.3
64.9
47.2
ASP-143
PHE-144
25.0
25.1
12.1
-24.9
94.7
91.0
0.9
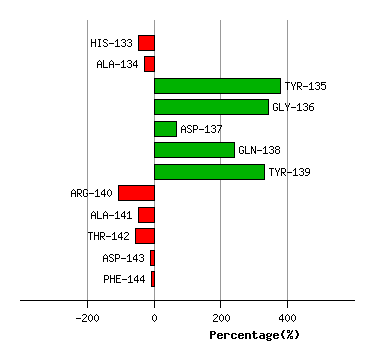
Graph shows rotational transition at bending residues and can be used
to identify hinge bending residues.
Probably only informative for interdomain rotations greater than 20 degrees
Residue
iResidue
i+1Distance of hinge axis to residue i in
(A) Distance of hinge axis to residue i in
(A) Change in
(deg) Change in
(deg) Angle of psi(i) axis to hinge axis
(deg) Angle of psi(i) axis to hinge axis
(deg) Percentage Progress
ALA-268
CYS-269
8.0
8.1
-16.2
26.4
91.0
94.6
-21.7
CYS-269
LYS-270
9.9
8.7
4.6
36.8
121.8
138.2
-81.8
LYS-270
ASN-271
11.5
10.0
33.8
63.7
59.2
62.8
247.9
ASN-271
TYR-272
13.9
9.7
144.0
-12.5
127.6
33.2
-110.9
TYR-272
ASP-273
17.4
12.6
8.9
11.0
114.6
35.7
63.4
ASP-273
GLY-274
17.2
11.9
-26.4
-139.2
63.8
113.8
-39.5
GLY-274
ASP-275
13.6
8.1
148.7
73.9
52.4
57.0
352.6
ASP-275
VAL-276
11.9
9.8
141.5
57.3
123.4
22.8
-113.7
VAL-276
GLN-277
11.9
11.8
175.5
-12.7
54.9
52.1
-486.7
GLN-277
SER-278
10.0
9.8
-162.1
69.2
121.3
111.3
-41.5
SER-278
ASP-279
11.9
6.3
168.6
1.9
61.6
31.9
454.1
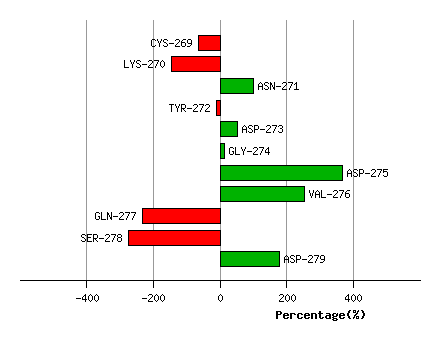
Graph shows rotational transition at bending residues and can be used
to identify hinge bending residues.
Probably only informative for interdomain rotations greater than 20 degrees