Toxin A
(All numbering and residues are taken from first PDB file)
![]()
![]()
Bending Residue Dihedral Analysis
Residue
iResidue
i+1Distance of hinge axis to residue i in
(A) Distance of hinge axis to residue i in
(A) Change in
(deg) Change in
(deg) Angle of psi(i) axis to hinge axis
(deg) Angle of psi(i) axis to hinge axis
(deg) Percentage Progress
GLN-164
ILE-165
8.2
8.5
3.7
6.2
94.0
86.7
24.0
ILE-165
GLY-166
8.4
8.7
-0.8
5.1
141.9
147.2
70.7
GLY-166
VAL-167
9.3
9.6
-3.3
1.7
130.2
132.7
4.8
VAL-167
PHE-168
8.3
8.5
4.4
-1.4
46.8
52.9
52.6
PHE-168
LYS-169
6.3
6.3
2.5
-4.7
51.7
51.7
-10.0
LYS-169
GLY-170
4.2
4.1
12.7
-13.4
99.3
102.0
-4.2
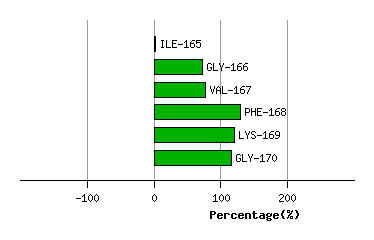
Graph shows rotational transition at bending residues and can be used
to identify hinge bending residues.
Probably only informative for interdomain rotations greater than 20 degrees
Residue
iResidue
i+1Distance of hinge axis to residue i in
(A) Distance of hinge axis to residue i in
(A) Change in
(deg) Change in
(deg) Angle of psi(i) axis to hinge axis
(deg) Angle of psi(i) axis to hinge axis
(deg) Percentage Progress
TYR-176
PHE-177
6.8
7.0
2.4
-2.1
38.9
36.2
-17.2
PHE-177
ALA-178
4.8
5.1
5.2
-5.5
46.9
48.8
21.5
ALA-178
PRO-179
7.0
7.4
2.2
1.7
29.2
25.6
68.8
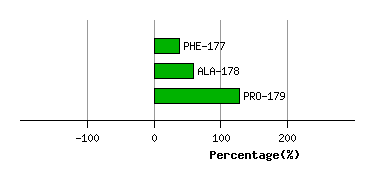
Graph shows rotational transition at bending residues and can be used
to identify hinge bending residues.
Probably only informative for interdomain rotations greater than 20 degrees
Residue
iResidue
i+1Distance of hinge axis to residue i in
(A) Distance of hinge axis to residue i in
(A) Change in
(deg) Change in
(deg) Angle of psi(i) axis to hinge axis
(deg) Angle of psi(i) axis to hinge axis
(deg) Percentage Progress
GLY-189
GLN-190
4.2
4.6
2.5
-3.4
71.4
70.3
-18.3
GLN-190
ALA-191
1.5
1.8
8.4
-5.4
47.1
44.5
8.8
ALA-191
ILE-192
3.3
3.4
3.0
-8.9
112.5
110.1
71.7
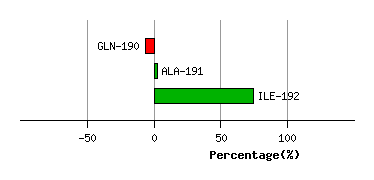
Graph shows rotational transition at bending residues and can be used
to identify hinge bending residues.
Probably only informative for interdomain rotations greater than 20 degrees