Signal Recognition 54 Kda Protein
(All numbering and residues are taken from first PDB file)
![]()
![]()
Bending Residue Dihedral Analysis
Residue
iResidue
i+1Distance of hinge axis to residue i in
(A) Distance of hinge axis to residue i in
(A) Change in
(deg) Change in
(deg) Angle of psi(i) axis to hinge axis
(deg) Angle of psi(i) axis to hinge axis
(deg) Percentage Progress
LEU-292
GLY-293
1.5
4.8
107.6
-175.5
118.2
102.4
47.9
GLY-293
MET-294
2.0
5.4
142.1
-34.0
173.5
135.7
-128.4
MET-294
GLY-295
3.6
3.5
151.9
-50.9
127.2
127.5
245.2
GLY-295
ASP-296
3.7
2.1
75.4
17.8
80.4
140.7
-15.7
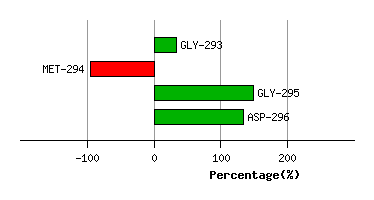
Graph shows rotational transition at bending residues and can be used
to identify hinge bending residues.
Probably only informative for interdomain rotations greater than 20 degrees
Residue
iResidue
i+1Distance of hinge axis to residue i in
(A) Distance of hinge axis to residue i in
(A) Change in
(deg) Change in
(deg) Angle of psi(i) axis to hinge axis
(deg) Angle of psi(i) axis to hinge axis
(deg) Percentage Progress
TYR-310
ASP-311
2.9
2.1
54.9
-14.0
40.5
38.5
51.1
ASP-311
LYS-312
5.1
4.7
22.3
20.2
44.6
44.6
36.8
LYS-312
ILE-313
3.5
2.1
11.9
-8.0
51.0
43.4
12.9
ILE-313
GLN-314
0.1
2.3
-39.1
52.0
45.8
48.9
2.3
ILE-313
GLN-314
0.1
2.3
-39.1
52.0
45.8
48.9
2.3
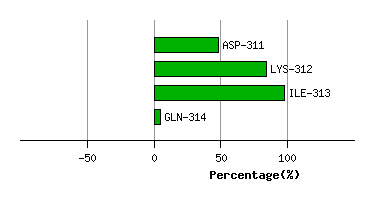
Graph shows rotational transition at bending residues and can be used
to identify hinge bending residues.
Probably only informative for interdomain rotations greater than 20 degrees
Residue
iResidue
i+1Distance of hinge axis to residue i in
(A) Distance of hinge axis to residue i in
(A) Change in
(deg) Change in
(deg) Angle of psi(i) axis to hinge axis
(deg) Angle of psi(i) axis to hinge axis
(deg) Percentage Progress
ILE-313
GLN-314
0.1
2.3
-39.1
52.0
45.8
48.9
2.3
ILE-313
GLN-314
0.1
2.3
-39.1
52.0
45.8
48.9
2.3
GLN-314
LYS-315
3.5
5.3
-74.3
74.5
41.2
29.5
-1.7
LYS-315
LYS-316
3.7
5.4
-44.5
-66.9
54.3
45.5
78.8
LYS-316
MET-317
1.9
3.2
-169.9
-33.9
52.4
128.8
-6.3
MET-317
GLU-318
1.6
3.2
-84.3
39.0
37.2
63.1
60.6
GLU-318
ASP-319
3.2
5.2
174.6
21.9
135.1
125.3
-151.0
LEU-327
THR-328
10.0
10.9
39.9
-61.2
20.6
98.3
-13.9
THR-328
LEU-329
8.6
9.7
158.7
106.1
72.7
72.9
-40.5
LEU-329
ARG-330
11.2
12.7
28.3
-22.0
19.8
32.6
14.4
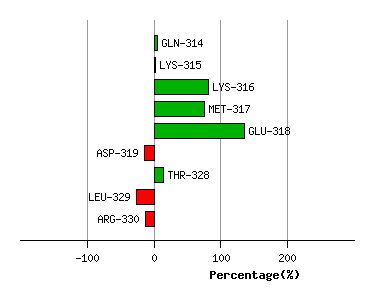
Graph shows rotational transition at bending residues and can be used
to identify hinge bending residues.
Probably only informative for interdomain rotations greater than 20 degrees