Maltodextrin Phosphorylase
(All numbering and residues are taken from first PDB file)
![]()
![]()
Bending Residue Dihedral Analysis
Residue
iResidue
i+1Distance of hinge axis to residue i in
(A) Distance of hinge axis to residue i in
(A) Change in
(deg) Change in
(deg) Angle of psi(i) axis to hinge axis
(deg) Angle of psi(i) axis to hinge axis
(deg) Percentage Progress
TRP-18
GLN-19
15.6
15.3
-4.9
2.0
147.4
148.5
-5.6
GLN-19
ARG-20
17.3
16.9
1.3
-5.2
45.9
44.4
-67.9
ARG-20
TYR-21
13.8
13.6
12.3
-9.1
72.0
73.4
12.0
TYR-21
GLY-22
13.8
13.5
-1.0
16.4
120.4
120.6
160.5
GLY-22
LEU-23
17.2
16.9
-21.9
7.1
64.8
58.7
-2.0
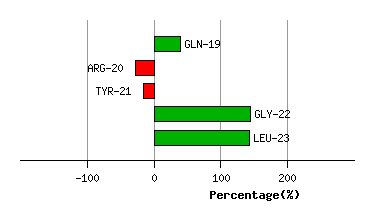
Graph shows rotational transition at bending residues and can be used
to identify hinge bending residues.
Probably only informative for interdomain rotations greater than 20 degrees
Residue
iResidue
i+1Distance of hinge axis to residue i in
(A) Distance of hinge axis to residue i in
(A) Change in
(deg) Change in
(deg) Angle of psi(i) axis to hinge axis
(deg) Angle of psi(i) axis to hinge axis
(deg) Percentage Progress
VAL-38
SER-39
9.7
9.4
-1.0
2.0
88.2
89.4
-16.7
SER-39
GLU-40
6.3
5.9
0.3
5.1
54.4
53.8
-11.1
GLU-40
ALA-41
7.7
7.4
-3.1
-2.8
66.8
66.7
83.9
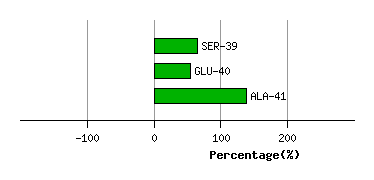
Graph shows rotational transition at bending residues and can be used
to identify hinge bending residues.
Probably only informative for interdomain rotations greater than 20 degrees
Residue
iResidue
i+1Distance of hinge axis to residue i in
(A) Distance of hinge axis to residue i in
(A) Change in
(deg) Change in
(deg) Angle of psi(i) axis to hinge axis
(deg) Angle of psi(i) axis to hinge axis
(deg) Percentage Progress
GLY-82
TRP-83
8.7
8.6
-0.7
-1.8
72.8
68.8
25.9
TRP-83
TYR-84
9.6
9.3
-1.3
5.0
91.9
90.4
-127.8
TYR-84
GLN-85
7.5
7.2
-6.4
1.8
109.3
111.2
106.8
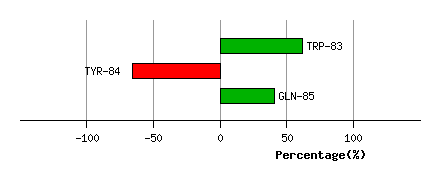
Graph shows rotational transition at bending residues and can be used
to identify hinge bending residues.
Probably only informative for interdomain rotations greater than 20 degrees
Residue
iResidue
i+1Distance of hinge axis to residue i in
(A) Distance of hinge axis to residue i in
(A) Change in
(deg) Change in
(deg) Angle of psi(i) axis to hinge axis
(deg) Angle of psi(i) axis to hinge axis
(deg) Percentage Progress
ASP-95
ILE-96
20.3
20.0
-3.1
1.2
101.0
102.9
62.7
ILE-96
ASN-97
16.7
16.4
4.0
-15.0
147.3
145.9
85.8
ASN-97
LEU-98
14.7
14.4
-4.2
8.9
107.6
107.9
-80.8
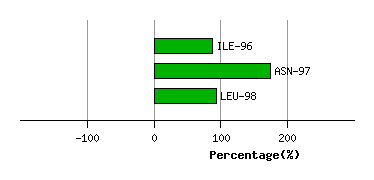
Graph shows rotational transition at bending residues and can be used
to identify hinge bending residues.
Probably only informative for interdomain rotations greater than 20 degrees
Residue
iResidue
i+1Distance of hinge axis to residue i in
(A) Distance of hinge axis to residue i in
(A) Change in
(deg) Change in
(deg) Angle of psi(i) axis to hinge axis
(deg) Angle of psi(i) axis to hinge axis
(deg) Percentage Progress
ASP-100
LEU-101
12.8
12.5
-1.5
6.0
30.0
29.6
-136.5
LEU-101
LEU-102
10.9
10.8
2.3
-3.7
95.3
97.4
90.9
LEU-102
GLU-103
7.5
7.6
-3.5
6.0
73.6
74.2
-53.4
GLU-103
GLU-104
9.9
10.0
3.2
-6.3
168.3
170.5
68.1
GLU-104
GLU-105
10.1
10.1
7.1
-0.5
114.8
116.5
-55.9
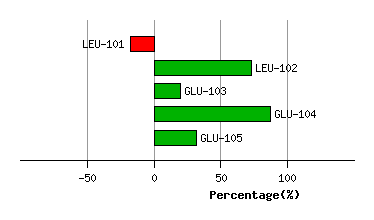
Graph shows rotational transition at bending residues and can be used
to identify hinge bending residues.
Probably only informative for interdomain rotations greater than 20 degrees
Residue
iResidue
i+1Distance of hinge axis to residue i in
(A) Distance of hinge axis to residue i in
(A) Change in
(deg) Change in
(deg) Angle of psi(i) axis to hinge axis
(deg) Angle of psi(i) axis to hinge axis
(deg) Percentage Progress
ILE-106
ASP-107
8.8
8.9
4.1
-6.3
77.3
77.0
191.7
ASP-107
PRO-108
8.5
8.6
2.9
0.3
145.7
146.3
-148.9
PRO-108
ALA-109
7.9
8.1
8.1
-6.3
92.3
88.2
16.7
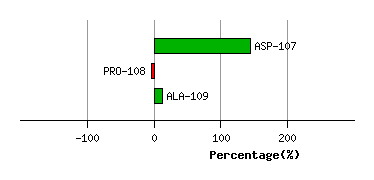
Graph shows rotational transition at bending residues and can be used
to identify hinge bending residues.
Probably only informative for interdomain rotations greater than 20 degrees
Residue
iResidue
i+1Distance of hinge axis to residue i in
(A) Distance of hinge axis to residue i in
(A) Change in
(deg) Change in
(deg) Angle of psi(i) axis to hinge axis
(deg) Angle of psi(i) axis to hinge axis
(deg) Percentage Progress
ALA-120
CYS-121
13.2
13.1
6.3
-7.7
154.3
153.5
-21.0
CYS-121
PHE-122
13.4
13.4
0.9
1.4
91.7
91.9
70.6
PHE-122
LEU-123
16.2
16.2
8.5
-8.9
62.3
61.6
-27.3
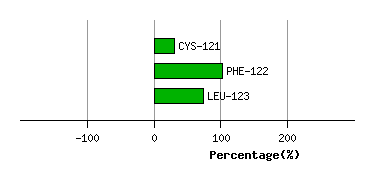
Graph shows rotational transition at bending residues and can be used
to identify hinge bending residues.
Probably only informative for interdomain rotations greater than 20 degrees
Residue
iResidue
i+1Distance of hinge axis to residue i in
(A) Distance of hinge axis to residue i in
(A) Change in
(deg) Change in
(deg) Angle of psi(i) axis to hinge axis
(deg) Angle of psi(i) axis to hinge axis
(deg) Percentage Progress
GLN-141
TYR-142
10.9
11.1
-2.6
6.7
123.1
123.1
12.1
TYR-142
GLY-143
13.5
13.7
2.3
9.7
35.2
33.0
161.7
GLY-143
LEU-144
14.9
14.9
-4.4
-2.6
88.0
87.4
-111.5
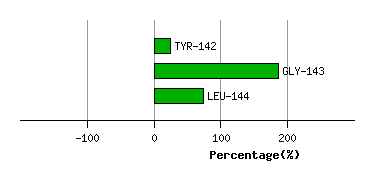
Graph shows rotational transition at bending residues and can be used
to identify hinge bending residues.
Probably only informative for interdomain rotations greater than 20 degrees
Residue
iResidue
i+1Distance of hinge axis to residue i in
(A) Distance of hinge axis to residue i in
(A) Change in
(deg) Change in
(deg) Angle of psi(i) axis to hinge axis
(deg) Angle of psi(i) axis to hinge axis
(deg) Percentage Progress
TRP-161
HIS-162
8.6
8.9
-3.7
12.9
113.3
115.6
-47.4
HIS-162
ARG-163
6.3
6.6
-6.3
-7.2
86.4
86.8
69.3
ARG-163
SER-164
5.2
5.5
0.9
3.5
61.3
62.1
-53.0
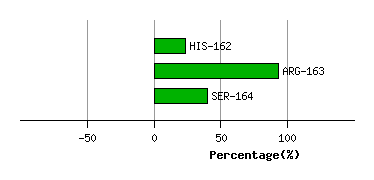
Graph shows rotational transition at bending residues and can be used
to identify hinge bending residues.
Probably only informative for interdomain rotations greater than 20 degrees
Residue
iResidue
i+1Distance of hinge axis to residue i in
(A) Distance of hinge axis to residue i in
(A) Change in
(deg) Change in
(deg) Angle of psi(i) axis to hinge axis
(deg) Angle of psi(i) axis to hinge axis
(deg) Percentage Progress
PRO-453
ARG-454
8.9
9.0
11.3
-7.2
107.5
110.0
-158.5
ARG-454
ARG-455
6.1
6.3
0.6
2.3
111.5
112.0
165.0
ARG-455
TRP-456
6.0
6.2
0.9
-0.6
46.3
48.7
-132.6
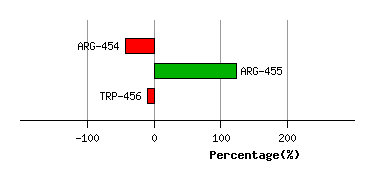
Graph shows rotational transition at bending residues and can be used
to identify hinge bending residues.
Probably only informative for interdomain rotations greater than 20 degrees
Residue
iResidue
i+1Distance of hinge axis to residue i in
(A) Distance of hinge axis to residue i in
(A) Change in
(deg) Change in
(deg) Angle of psi(i) axis to hinge axis
(deg) Angle of psi(i) axis to hinge axis
(deg) Percentage Progress
MET-777
PHE-778
18.3
18.5
-5.7
-5.7
155.8
156.2
-219.0
PHE-778
SER-779
17.5
17.6
9.5
-10.7
51.5
49.9
-59.9
SER-779
SER-780
15.1
15.3
-2.3
12.6
138.5
138.3
114.7
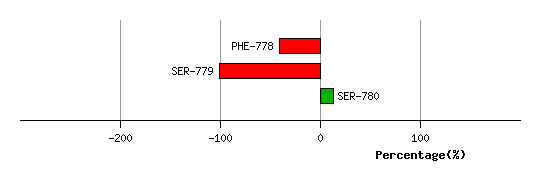
Graph shows rotational transition at bending residues and can be used
to identify hinge bending residues.
Probably only informative for interdomain rotations greater than 20 degrees