Elongation Factor G
(All numbering and residues are taken from first PDB file)
![]()
![]()
Bending Residue Dihedral Analysis
Residue
iResidue
i+1Distance of hinge axis to residue i in
(A) Distance of hinge axis to residue i in
(A) Change in
(deg) Change in
(deg) Angle of psi(i) axis to hinge axis
(deg) Angle of psi(i) axis to hinge axis
(deg) Percentage Progress
VAL-481
ALA-482
7.1
6.6
-44.0
42.5
104.8
109.2
-8.3
ALA-482
TYR-483
3.6
3.2
28.1
-27.0
73.8
60.5
67.7
TYR-483
ARG-484
1.5
1.5
-10.0
-2.2
97.8
97.9
10.6
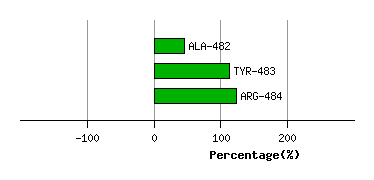
Graph shows rotational transition at bending residues and can be used
to identify hinge bending residues.
Probably only informative for interdomain rotations greater than 20 degrees
Residue
iResidue
i+1Distance of hinge axis to residue i in
(A) Distance of hinge axis to residue i in
(A) Change in
(deg) Change in
(deg) Angle of psi(i) axis to hinge axis
(deg) Angle of psi(i) axis to hinge axis
(deg) Percentage Progress
LEU-602
GLU-603
5.5
5.8
22.5
-13.6
65.0
60.8
28.8
GLU-603
PRO-604
5.6
5.8
14.3
-6.9
15.5
17.2
103.8
PRO-604
ILE-605
5.7
5.9
0.5
2.2
74.7
70.2
-50.3
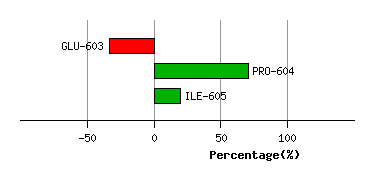
Graph shows rotational transition at bending residues and can be used
to identify hinge bending residues.
Probably only informative for interdomain rotations greater than 20 degrees
Residue
iResidue
i+1Distance of hinge axis to residue i in
(A) Distance of hinge axis to residue i in
(A) Change in
(deg) Change in
(deg) Angle of psi(i) axis to hinge axis
(deg) Angle of psi(i) axis to hinge axis
(deg) Percentage Progress
PHE-646
VAL-647
14.6
14.8
-25.0
37.1
132.7
133.6
48.8
VAL-647
PRO-648
13.4
14.0
-0.4
7.3
105.7
117.1
53.7
PRO-648
LEU-649
10.3
11.5
-17.0
25.2
81.3
80.2
1.4
LEU-649
ALA-650
9.7
9.8
-24.8
2.4
137.9
130.1
-93.1
ALA-650
GLU-651
10.2
10.9
13.8
-1.6
83.3
93.8
-39.8
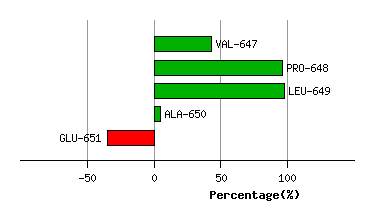
Graph shows rotational transition at bending residues and can be used
to identify hinge bending residues.
Probably only informative for interdomain rotations greater than 20 degrees
Residue
iResidue
i+1Distance of hinge axis to residue i in
(A) Distance of hinge axis to residue i in
(A) Change in
(deg) Change in
(deg) Angle of psi(i) axis to hinge axis
(deg) Angle of psi(i) axis to hinge axis
(deg) Percentage Progress
PHE-673
ASP-674
5.2
5.3
-24.3
38.1
75.0
83.5
34.3
ASP-674
HIS-675
7.8
8.0
7.4
-13.4
50.6
51.1
33.7
HIS-675
TYR-676
8.1
8.0
6.1
-4.0
23.6
22.4
-9.4
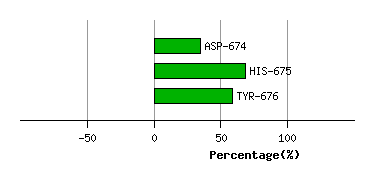
Graph shows rotational transition at bending residues and can be used
to identify hinge bending residues.
Probably only informative for interdomain rotations greater than 20 degrees
Residue
iResidue
i+1Distance of hinge axis to residue i in
(A) Distance of hinge axis to residue i in
(A) Change in
(deg) Change in
(deg) Angle of psi(i) axis to hinge axis
(deg) Angle of psi(i) axis to hinge axis
(deg) Percentage Progress
GLN-677
GLU-678
10.0
10.1
8.7
8.7
162.5
153.7
-176.7
GLU-678
VAL-679
10.2
9.9
103.1
-121.9
101.6
91.1
104.5
VAL-679
PRO-680
10.3
10.7
-25.9
24.6
44.2
23.5
25.8
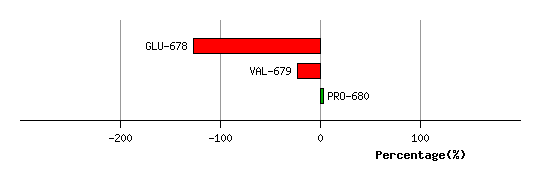
Graph shows rotational transition at bending residues and can be used
to identify hinge bending residues.
Probably only informative for interdomain rotations greater than 20 degrees