Cytochrome Bc1 Complex
(All numbering and residues are taken from first PDB file)
![]()
![]()
Bending Residue Dihedral Analysis
Residue
iResidue
i+1Distance of hinge axis to residue i in
(A) Distance of hinge axis to residue i in
(A) Change in
(deg) Change in
(deg) Angle of psi(i) axis to hinge axis
(deg) Angle of psi(i) axis to hinge axis
(deg) Percentage Progress
ALA-64
SER-65
19.4
19.5
-86.6
107.7
158.4
100.2
55.9
SER-65
ALA-66
20.5
20.7
142.5
-142.5
94.8
117.7
4.4
ALA-66
ASP-67
22.0
21.6
-12.2
52.8
107.0
124.7
19.3
ASP-67
VAL-68
19.1
19.6
-172.5
82.0
51.9
59.1
141.8
VAL-68
LEU-69
17.2
16.3
150.6
51.5
93.4
158.6
361.1
LEU-69
ALA-70
15.7
17.5
159.5
102.8
161.7
106.3
-530.6
ALA-70
MET-71
14.9
18.8
-90.5
-13.3
92.2
76.0
27.7
MET-71
SER-72
13.5
15.6
-33.2
-26.1
36.3
38.1
157.0
SER-72
LYS-73
12.3
14.0
150.4
-174.5
103.9
149.2
47.3
LYS-73
ILE-74
14.2
13.6
-116.6
16.9
137.0
90.0
-166.0
ILE-74
GLU-75
13.5
15.2
-30.0
-53.9
65.6
115.3
53.6
GLU-75
ILE-76
15.9
13.7
4.3
-26.5
67.7
125.7
49.8
ILE-76
LYS-77
15.4
15.3
20.7
-93.6
108.4
52.2
-51.4
LYS-77
LEU-78
18.4
16.0
43.4
-117.0
110.8
129.4
134.1
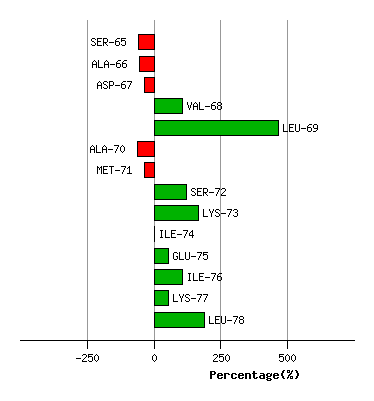
Graph shows rotational transition at bending residues and can be used
to identify hinge bending residues.
Probably only informative for interdomain rotations greater than 20 degrees