Receptor Tyrosine-Protein Kinase Erbb-4
(All numbering and residues are taken from first PDB file)
![]()
![]()
Bending Residue Dihedral Analysis
Residue
iResidue
i+1Distance of hinge axis to residue i in
(A) Distance of hinge axis to residue i in
(A) Change in
(deg) Change in
(deg) Angle of psi(i) axis to hinge axis
(deg) Angle of psi(i) axis to hinge axis
(deg) Percentage Progress
ILE-304
CYS-305
5.6
5.7
-9.1
-17.7
56.5
60.4
89.7
CYS-305
PRO-306
3.7
3.8
-5.1
-1.3
56.2
55.1
19.7
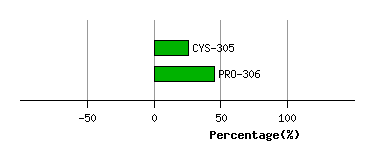
Graph shows rotational transition at bending residues and can be used
to identify hinge bending residues.
Probably only informative for interdomain rotations greater than 20 degrees
Residue
iResidue
i+1Distance of hinge axis to residue i in
(A) Distance of hinge axis to residue i in
(A) Change in
(deg) Change in
(deg) Angle of psi(i) axis to hinge axis
(deg) Angle of psi(i) axis to hinge axis
(deg) Percentage Progress
CYS-507
ILE-508
11.8
11.8
-2.0
2.5
30.4
24.5
9.8
ILE-508
GLU-509
10.8
11.0
5.2
-2.8
141.5
135.4
-18.1
GLU-509
SER-510
11.1
11.1
0.0
-0.7
104.7
101.5
-3.9
SER-510
CYS-511
7.6
7.5
-3.4
9.1
112.0
107.6
28.6
CYS-511
ASN-512
4.0
3.9
5.5
-6.2
136.1
137.8
-10.0
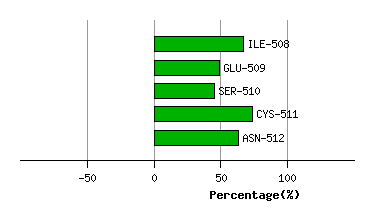
Graph shows rotational transition at bending residues and can be used
to identify hinge bending residues.
Probably only informative for interdomain rotations greater than 20 degrees
Residue
iResidue
i+1Distance of hinge axis to residue i in
(A) Distance of hinge axis to residue i in
(A) Change in
(deg) Change in
(deg) Angle of psi(i) axis to hinge axis
(deg) Angle of psi(i) axis to hinge axis
(deg) Percentage Progress
GLU-520
PHE-521
2.2
2.2
7.0
-6.0
66.9
72.6
-5.7
PHE-521
GLU-522
4.8
3.9
-10.7
4.5
53.2
53.9
8.4
GLU-522
ASN-523
6.5
5.5
0.0
-4.2
57.0
56.7
16.8
ASN-523
ASP-524
8.7
7.6
-0.7
11.3
74.1
69.4
-21.9
ASP-524
SER-525
11.4
10.3
-10.2
-2.1
79.4
87.4
23.4
SER-525
ILE-526
9.9
9.1
13.3
-12.1
118.5
117.4
-19.0
ILE-526
CYS-527
6.7
5.8
-3.9
5.3
124.7
121.5
-3.1
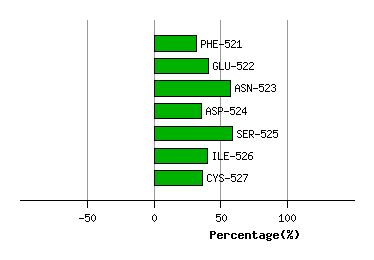
Graph shows rotational transition at bending residues and can be used
to identify hinge bending residues.
Probably only informative for interdomain rotations greater than 20 degrees