Gtp Pyrophosphokinase
(All numbering and residues are taken from first PDB file)
![]()
![]()
Bending Residue Dihedral Analysis
Residue
iResidue
i+1Distance of hinge axis to residue i in
(A) Distance of hinge axis to residue i in
(A) Change in
(deg) Change in
(deg) Angle of psi(i) axis to hinge axis
(deg) Angle of psi(i) axis to hinge axis
(deg) Percentage Progress
TYR-107
ILE-108
11.4
11.1
-9.4
8.9
130.9
132.1
-0.2
ILE-108
THR-109
9.0
8.1
7.2
-8.7
75.2
61.8
-27.8
THR-109
HIS-110
12.0
10.8
10.6
-19.1
69.5
64.6
-12.8
HIS-110
ARG-111
14.3
13.2
25.6
-9.4
63.8
83.4
75.0
ARG-111
LYS-112
12.8
12.3
30.9
-17.6
78.2
91.7
25.8
LYS-112
ALA-113
15.4
15.0
7.3
-6.3
9.8
14.2
15.0
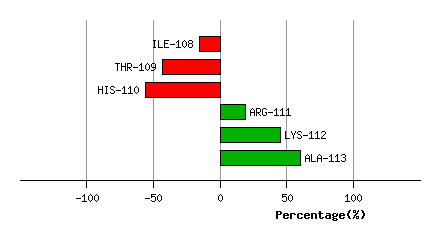
Graph shows rotational transition at bending residues and can be used
to identify hinge bending residues.
Probably only informative for interdomain rotations greater than 20 degrees
Residue
iResidue
i+1Distance of hinge axis to residue i in
(A) Distance of hinge axis to residue i in
(A) Change in
(deg) Change in
(deg) Angle of psi(i) axis to hinge axis
(deg) Angle of psi(i) axis to hinge axis
(deg) Percentage Progress
ARG-117
SER-118
8.8
8.7
3.0
-2.5
41.2
35.9
84.6
SER-118
TYR-119
7.9
7.6
-15.9
24.8
141.1
136.3
29.8
TYR-119
HIS-120
7.5
7.2
-5.7
4.4
138.8
140.2
-13.8
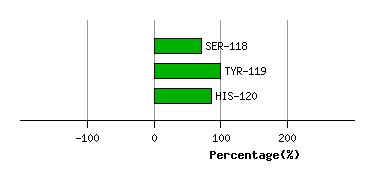
Graph shows rotational transition at bending residues and can be used
to identify hinge bending residues.
Probably only informative for interdomain rotations greater than 20 degrees
Residue
iResidue
i+1Distance of hinge axis to residue i in
(A) Distance of hinge axis to residue i in
(A) Change in
(deg) Change in
(deg) Angle of psi(i) axis to hinge axis
(deg) Angle of psi(i) axis to hinge axis
(deg) Percentage Progress
GLN-141
ILE-142
7.8
8.0
-23.4
22.9
108.6
108.1
-25.4
ILE-142
ARG-143
4.4
4.5
4.5
-11.5
10.9
11.3
-147.3
ARG-143
THR-144
4.1
4.1
5.2
6.8
63.5
65.4
225.0
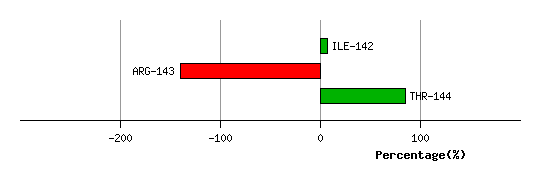
Graph shows rotational transition at bending residues and can be used
to identify hinge bending residues.
Probably only informative for interdomain rotations greater than 20 degrees