Atp Synthase Gamma Chain, Mitochondrial Precursor
(All numbering and residues are taken from first PDB file)
![]()
![]()
Bending Residue Dihedral Analysis
Residue
iResidue
i+1Distance of hinge axis to residue i in
(A) Distance of hinge axis to residue i in
(A) Change in
(deg) Change in
(deg) Angle of psi(i) axis to hinge axis
(deg) Angle of psi(i) axis to hinge axis
(deg) Percentage Progress
LYS-24
MET-25
1.3
1.4
13.4
-7.3
114.8
116.9
36.5
MET-25
VAL-26
3.3
3.4
0.3
-9.2
113.5
115.2
21.3
VAL-26
ALA-27
3.1
3.0
5.5
3.8
41.0
43.2
98.1
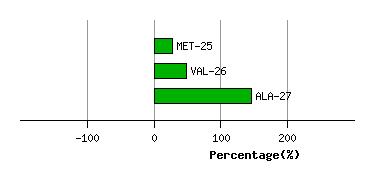
Graph shows rotational transition at bending residues and can be used
to identify hinge bending residues.
Probably only informative for interdomain rotations greater than 20 degrees
Residue
iResidue
i+1Distance of hinge axis to residue i in
(A) Distance of hinge axis to residue i in
(A) Change in
(deg) Change in
(deg) Angle of psi(i) axis to hinge axis
(deg) Angle of psi(i) axis to hinge axis
(deg) Percentage Progress
GLU-130
VAL-131
18.8
18.8
-11.0
6.7
62.3
59.0
-26.1
VAL-131
GLY-132
17.4
17.5
-20.9
17.4
76.5
78.3
30.1
GLY-132
ARG-133
14.0
14.1
6.0
-1.6
34.9
41.7
17.7
ARG-133
ARG-134
12.8
12.4
-3.5
17.9
113.6
109.5
-1.1
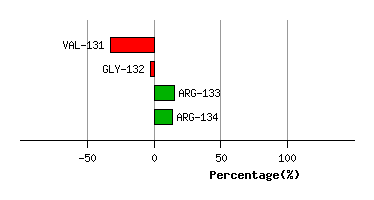
Graph shows rotational transition at bending residues and can be used
to identify hinge bending residues.
Probably only informative for interdomain rotations greater than 20 degrees
Residue
iResidue
i+1Distance of hinge axis to residue i in
(A) Distance of hinge axis to residue i in
(A) Change in
(deg) Change in
(deg) Angle of psi(i) axis to hinge axis
(deg) Angle of psi(i) axis to hinge axis
(deg) Percentage Progress
ARG-166
SER-167
11.7
11.8
19.7
-23.4
54.2
63.8
-49.3
SER-167
VAL-168
9.9
10.1
0.4
6.7
52.6
56.2
117.5
VAL-168
ILE-169
7.3
7.4
-2.8
1.5
59.0
63.5
95.5
ILE-169
SER-170
4.8
4.8
-30.9
38.4
48.0
60.3
-162.0
SER-170
TYR-171
6.4
6.6
-7.1
8.8
108.0
112.6
-1.7
TYR-171
LYS-172
8.9
8.9
-0.3
-5.5
40.0
39.7
24.3
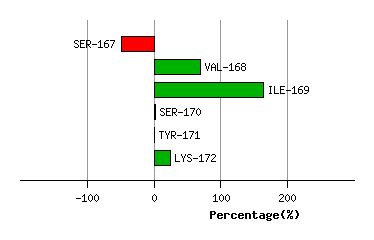
Graph shows rotational transition at bending residues and can be used
to identify hinge bending residues.
Probably only informative for interdomain rotations greater than 20 degrees
Residue
iResidue
i+1Distance of hinge axis to residue i in
(A) Distance of hinge axis to residue i in
(A) Change in
(deg) Change in
(deg) Angle of psi(i) axis to hinge axis
(deg) Angle of psi(i) axis to hinge axis
(deg) Percentage Progress
SER-223
GLU-224
10.1
10.0
-0.1
-1.0
114.9
116.2
47.8
GLU-224
GLN-225
9.1
9.1
7.5
3.9
55.3
53.7
88.6
GLN-225
SER-226
7.2
7.2
-17.3
-1.4
63.0
63.6
90.2
SER-226
ALA-227
6.1
5.7
18.9
-13.7
108.9
118.2
-141.8
ALA-227
ARG-228
4.3
4.4
19.7
-13.9
48.0
49.3
-22.2
ARG-228
MET-229
3.9
3.8
6.3
-0.9
71.2
76.4
7.8
MET-229
THR-230
1.7
1.5
-0.8
-0.1
48.0
48.3
-20.5
THR-230
ALA-231
1.0
0.8
6.0
-7.1
90.3
84.6
42.5
ALA-231
MET-232
3.0
3.4
-4.9
-1.9
141.1
141.1
-30.3
MET-232
ASP-233
3.6
3.8
0.2
-3.6
89.9
89.3
38.7
ASP-233
ASN-234
4.6
4.8
-3.8
3.4
57.8
55.9
53.7
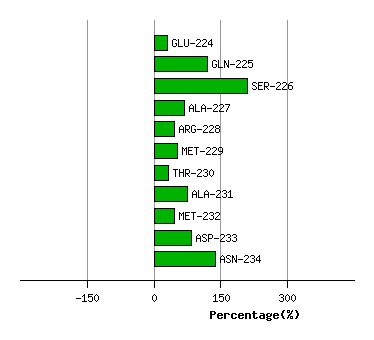
Graph shows rotational transition at bending residues and can be used
to identify hinge bending residues.
Probably only informative for interdomain rotations greater than 20 degrees