Aspartate Aminotransferase (E.C.2.6.1.1)
(All numbering and residues are taken from first PDB file)
![]()
![]()
Bending Residue Dihedral Analysis
Residue
iResidue
i+1Distance of hinge axis to residue i in
(A) Distance of hinge axis to residue i in
(A) Change in
(deg) Change in
(deg) Angle of psi(i) axis to hinge axis
(deg) Angle of psi(i) axis to hinge axis
(deg) Percentage Progress
ASN-34
LEU-35
14.2
14.0
7.8
7.3
83.3
82.4
-6.6
LEU-35
GLY-36
10.8
10.7
-8.0
-26.9
140.5
121.8
-151.5
GLY-36
VAL-37
11.2
10.9
91.5
-4.9
106.1
127.3
-281.1
VAL-37
GLY-38
10.7
10.6
-28.9
-8.3
50.7
95.0
75.7
GLY-38
ALA-39
7.7
9.3
-74.0
-3.1
22.7
33.1
542.1
ALA-39
TYR-40
8.8
8.8
31.0
1.3
127.6
121.5
-151.5
TYR-40
ARG-41
6.5
6.2
3.3
-10.1
127.8
126.8
60.3
ARG-41
ASP-42
7.9
7.5
-5.2
5.3
46.2
55.5
-21.9
ASP-42
ASP-43
6.9
6.5
7.1
2.6
83.2
77.5
17.8
ASP-43
ASN-44
8.3
8.3
-17.8
7.4
79.9
83.7
-4.5
ASN-44
GLY-45
11.6
11.2
5.8
3.5
34.6
42.3
41.1
GLY-45
LYS-46
11.4
11.3
-21.4
13.4
79.5
74.7
-17.8
LYS-46
PRO-47
11.9
11.4
-0.7
-4.0
97.1
97.5
-32.3
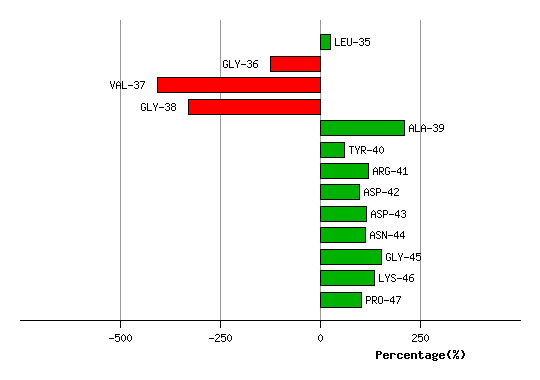
Graph shows rotational transition at bending residues and can be used
to identify hinge bending residues.
Probably only informative for interdomain rotations greater than 20 degrees
Residue
iResidue
i+1Distance of hinge axis to residue i in
(A) Distance of hinge axis to residue i in
(A) Change in
(deg) Change in
(deg) Angle of psi(i) axis to hinge axis
(deg) Angle of psi(i) axis to hinge axis
(deg) Percentage Progress
MET-326
ALA-327
1.3
1.7
0.8
5.2
142.7
141.2
-68.8
ALA-327
ASP-328
3.5
4.0
1.8
-5.2
82.6
85.0
3.9
ASP-328
ARG-329
5.4
5.4
7.6
-2.7
99.4
99.5
31.1
ARG-329
ILE-330
4.3
4.2
-1.6
-1.8
17.3
14.0
20.2
ILE-330
ILE-331
3.7
3.6
-2.8
-3.8
71.1
68.1
42.8
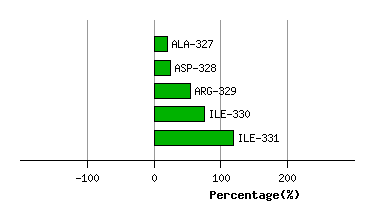
Graph shows rotational transition at bending residues and can be used
to identify hinge bending residues.
Probably only informative for interdomain rotations greater than 20 degrees
Residue
iResidue
i+1Distance of hinge axis to residue i in
(A) Distance of hinge axis to residue i in
(A) Change in
(deg) Change in
(deg) Angle of psi(i) axis to hinge axis
(deg) Angle of psi(i) axis to hinge axis
(deg) Percentage Progress
GLN-356
ILE-357
6.3
6.8
-0.2
-6.8
23.7
22.8
11.5
ILE-357
GLY-358
5.3
5.7
-26.7
2.3
89.8
84.8
77.9
GLY-358
MET-359
3.1
3.2
1.7
10.5
106.8
91.9
15.0
MET-359
PHE-360
1.4
1.3
-19.7
21.3
128.6
144.1
-23.7
PHE-360
CYS-361
2.1
1.4
-34.4
3.1
113.1
113.3
-60.2
CYS-361
PHE-362
4.1
3.2
-3.2
8.6
154.3
152.3
8.7
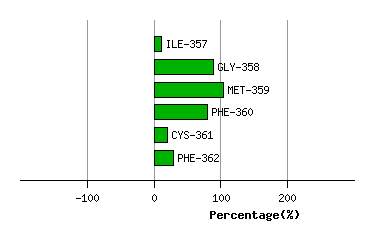
Graph shows rotational transition at bending residues and can be used
to identify hinge bending residues.
Probably only informative for interdomain rotations greater than 20 degrees