Glutamate Receptor 2
(All numbering and residues are taken from first PDB file)
![]()
![]()
Bending Residue Dihedral Analysis
Residue
iResidue
i+1Distance of hinge axis to residue i in
(A) Distance of hinge axis to residue i in
(A) Change in
(deg) Change in
(deg) Angle of psi(i) axis to hinge axis
(deg) Angle of psi(i) axis to hinge axis
(deg) Percentage Progress
SER-108
LEU-109
8.0
8.2
-9.4
4.4
124.7
127.4
-29.5
LEU-109
GLY-110
6.2
6.4
-5.2
15.4
159.8
159.4
129.4
GLY-110
ILE-111
6.4
6.5
13.6
-9.8
55.3
55.0
9.2
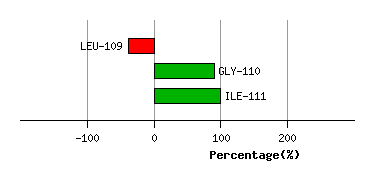
Graph shows rotational transition at bending residues and can be used
to identify hinge bending residues.
Probably only informative for interdomain rotations greater than 20 degrees
Residue
iResidue
i+1Distance of hinge axis to residue i in
(A) Distance of hinge axis to residue i in
(A) Change in
(deg) Change in
(deg) Angle of psi(i) axis to hinge axis
(deg) Angle of psi(i) axis to hinge axis
(deg) Percentage Progress
SER-194
THR-195
1.8
2.1
9.3
-2.2
29.9
28.4
101.6
THR-195
MET-196
2.4
2.9
-8.3
11.1
87.4
86.4
15.9
MET-196
ASN-197
5.4
5.8
-6.2
10.5
57.4
59.8
-35.6
ASN-197
GLU-198
4.4
4.6
-7.5
15.1
57.2
52.4
-72.6
ASN-197
GLU-198
4.4
4.6
-7.5
15.1
57.2
52.4
-72.6
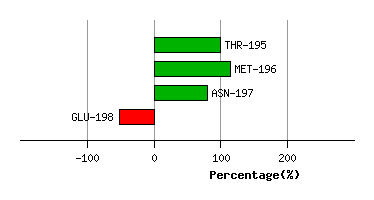
Graph shows rotational transition at bending residues and can be used
to identify hinge bending residues.
Probably only informative for interdomain rotations greater than 20 degrees
Residue
iResidue
i+1Distance of hinge axis to residue i in
(A) Distance of hinge axis to residue i in
(A) Change in
(deg) Change in
(deg) Angle of psi(i) axis to hinge axis
(deg) Angle of psi(i) axis to hinge axis
(deg) Percentage Progress
ASN-197
GLU-198
4.4
4.6
-7.5
15.1
57.2
52.4
-72.6
ASN-197
GLU-198
4.4
4.6
-7.5
15.1
57.2
52.4
-72.6
GLU-198
TYR-199
4.1
4.0
-17.6
9.0
39.3
47.7
89.5
TYR-199
ILE-200
5.8
6.1
-1.9
2.8
108.3
111.9
34.3
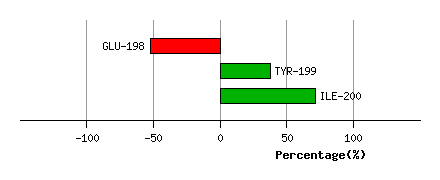
Graph shows rotational transition at bending residues and can be used
to identify hinge bending residues.
Probably only informative for interdomain rotations greater than 20 degrees
Residue
iResidue
i+1Distance of hinge axis to residue i in
(A) Distance of hinge axis to residue i in
(A) Change in
(deg) Change in
(deg) Angle of psi(i) axis to hinge axis
(deg) Angle of psi(i) axis to hinge axis
(deg) Percentage Progress
ASN-214
LEU-215
5.1
5.4
2.6
-7.3
140.1
140.0
47.7
LEU-215
ASP-216
6.4
6.8
-8.9
8.9
106.5
107.3
-20.6
ASP-216
SER-217
9.3
9.6
1.4
-5.8
9.6
8.2
-39.8
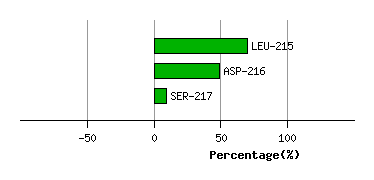
Graph shows rotational transition at bending residues and can be used
to identify hinge bending residues.
Probably only informative for interdomain rotations greater than 20 degrees
Residue
iResidue
i+1Distance of hinge axis to residue i in
(A) Distance of hinge axis to residue i in
(A) Change in
(deg) Change in
(deg) Angle of psi(i) axis to hinge axis
(deg) Angle of psi(i) axis to hinge axis
(deg) Percentage Progress
ASN-252
LYS-253
4.4
4.3
-11.7
7.9
60.6
61.5
0.1
LYS-253
TRP-254
4.3
4.4
0.3
7.1
59.4
59.6
39.1
TRP-254
TRP-255
4.9
4.8
-10.4
10.3
159.9
158.7
14.0
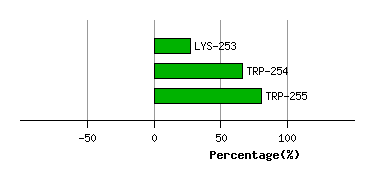
Graph shows rotational transition at bending residues and can be used
to identify hinge bending residues.
Probably only informative for interdomain rotations greater than 20 degrees