Hypothetical Protein Ph1897
(All numbering and residues are taken from first PDB file)
![]()
![]()
Bending Residue Dihedral Analysis
Residue
iResidue
i+1Distance of hinge axis to residue i in
(A) Distance of hinge axis to residue i in
(A) Change in
(deg) Change in
(deg) Angle of psi(i) axis to hinge axis
(deg) Angle of psi(i) axis to hinge axis
(deg) Percentage Progress
ASP-12
ILE-13
5.3
5.3
-1.0
3.0
35.8
35.1
-19.4
ILE-13
ILE-14
3.0
3.2
1.0
-0.5
129.7
130.6
4.5
ILE-14
ARG-15
2.1
2.3
-4.3
1.3
53.1
53.4
18.3
ARG-15
ASP-16
5.4
5.7
4.2
-4.0
131.4
132.8
-0.9
ASP-16
PHE-17
5.5
5.7
2.4
-0.6
139.0
139.6
-16.3
PHE-17
ASP-18
2.3
2.5
3.9
1.7
132.7
130.2
-29.9
PHE-17
ASP-18
2.3
2.5
3.9
1.7
132.7
130.2
-29.9
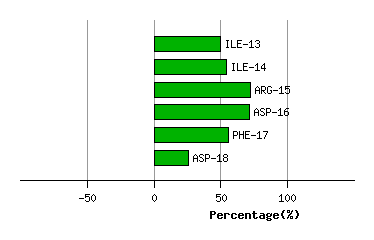
Graph shows rotational transition at bending residues and can be used
to identify hinge bending residues.
Probably only informative for interdomain rotations greater than 20 degrees
Residue
iResidue
i+1Distance of hinge axis to residue i in
(A) Distance of hinge axis to residue i in
(A) Change in
(deg) Change in
(deg) Angle of psi(i) axis to hinge axis
(deg) Angle of psi(i) axis to hinge axis
(deg) Percentage Progress
PHE-17
ASP-18
2.3
2.5
3.9
1.7
132.7
130.2
-29.9
PHE-17
ASP-18
2.3
2.5
3.9
1.7
132.7
130.2
-29.9
ASP-18
HIS-19
3.8
4.4
-6.9
0.2
54.8
52.8
32.2
HIS-19
ASN-20
6.4
6.9
3.0
-4.4
131.1
130.1
14.9
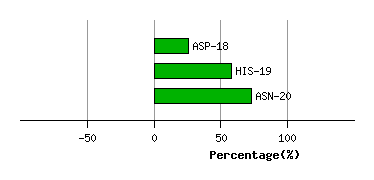
Graph shows rotational transition at bending residues and can be used
to identify hinge bending residues.
Probably only informative for interdomain rotations greater than 20 degrees
Residue
iResidue
i+1Distance of hinge axis to residue i in
(A) Distance of hinge axis to residue i in
(A) Change in
(deg) Change in
(deg) Angle of psi(i) axis to hinge axis
(deg) Angle of psi(i) axis to hinge axis
(deg) Percentage Progress
GLU-51
ASN-52
10.9
11.6
-7.7
-6.2
69.0
66.1
31.6
ASN-52
ILE-53
11.9
12.2
34.4
-49.9
136.0
125.7
63.2
ILE-53
ILE-54
9.2
9.1
9.4
-26.1
152.7
138.6
81.9
ILE-54
ILE-55
8.5
7.9
-12.6
2.2
60.8
63.8
27.8
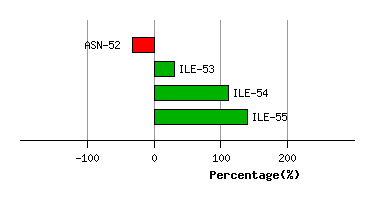
Graph shows rotational transition at bending residues and can be used
to identify hinge bending residues.
Probably only informative for interdomain rotations greater than 20 degrees
Residue
iResidue
i+1Distance of hinge axis to residue i in
(A) Distance of hinge axis to residue i in
(A) Change in
(deg) Change in
(deg) Angle of psi(i) axis to hinge axis
(deg) Angle of psi(i) axis to hinge axis
(deg) Percentage Progress
VAL-83
ASP-84
11.8
10.9
-18.5
7.7
17.7
14.0
73.4
ASP-84
PRO-85
11.5
10.6
2.7
-7.8
109.2
107.5
18.3
PRO-85
LEU-86
8.8
7.6
15.9
-2.9
130.2
133.1
-70.7
LEU-86
ASP-87
8.4
7.8
-21.5
13.0
102.2
96.9
-20.5
LEU-86
ASP-87
8.4
7.8
-21.5
13.0
102.2
96.9
-20.5
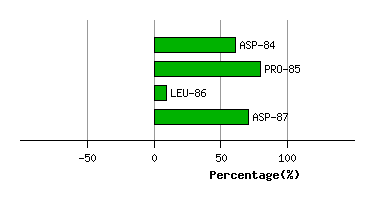
Graph shows rotational transition at bending residues and can be used
to identify hinge bending residues.
Probably only informative for interdomain rotations greater than 20 degrees
Residue
iResidue
i+1Distance of hinge axis to residue i in
(A) Distance of hinge axis to residue i in
(A) Change in
(deg) Change in
(deg) Angle of psi(i) axis to hinge axis
(deg) Angle of psi(i) axis to hinge axis
(deg) Percentage Progress
LEU-86
ASP-87
8.4
7.8
-21.5
13.0
102.2
96.9
-20.5
LEU-86
ASP-87
8.4
7.8
-21.5
13.0
102.2
96.9
-20.5
ASP-87
GLY-88
11.0
10.7
2.0
-6.6
39.1
41.9
-12.1
GLY-88
SER-89
11.6
11.5
1.3
-4.4
41.0
44.0
-13.0
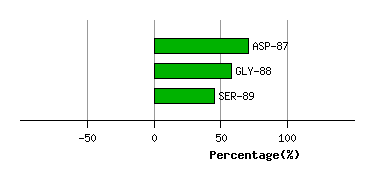
Graph shows rotational transition at bending residues and can be used
to identify hinge bending residues.
Probably only informative for interdomain rotations greater than 20 degrees