Beta-Secretase 1
(All numbering and residues are taken from first PDB file)
![]()
![]()
Bending Residue Dihedral Analysis
Residue
iResidue
i+1Distance of hinge axis to residue i in
(A) Distance of hinge axis to residue i in
(A) Change in
(deg) Change in
(deg) Angle of psi(i) axis to hinge axis
(deg) Angle of psi(i) axis to hinge axis
(deg) Percentage Progress
LEU-188
TRP-189
8.6
8.7
-18.4
8.4
25.0
25.9
191.6
TRP-189
TYR-190
9.0
9.4
19.9
-10.2
130.5
127.8
-49.6
TYR-190
THR-191
7.2
7.5
2.0
3.8
157.0
157.4
-50.2
THR-191
PRO-192
5.9
6.1
3.3
-2.8
62.8
61.8
-58.1
THR-191
PRO-192
5.9
6.1
3.3
-2.8
62.8
61.8
-58.1
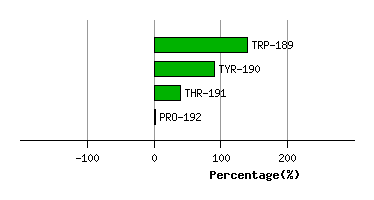
Graph shows rotational transition at bending residues and can be used
to identify hinge bending residues.
Probably only informative for interdomain rotations greater than 20 degrees
Residue
iResidue
i+1Distance of hinge axis to residue i in
(A) Distance of hinge axis to residue i in
(A) Change in
(deg) Change in
(deg) Angle of psi(i) axis to hinge axis
(deg) Angle of psi(i) axis to hinge axis
(deg) Percentage Progress
THR-191
PRO-192
5.9
6.1
3.3
-2.8
62.8
61.8
-58.1
THR-191
PRO-192
5.9
6.1
3.3
-2.8
62.8
61.8
-58.1
PRO-192
ILE-193
5.0
5.2
0.7
-1.2
80.4
80.0
60.6
ILE-193
ARG-194
2.4
2.6
3.6
-3.4
9.7
8.2
53.1
ARG-194
ARG-195
1.7
2.0
8.3
-12.6
61.9
61.1
-93.9
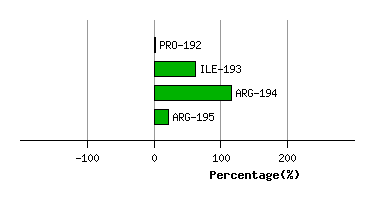
Graph shows rotational transition at bending residues and can be used
to identify hinge bending residues.
Probably only informative for interdomain rotations greater than 20 degrees
Residue
iResidue
i+1Distance of hinge axis to residue i in
(A) Distance of hinge axis to residue i in
(A) Change in
(deg) Change in
(deg) Angle of psi(i) axis to hinge axis
(deg) Angle of psi(i) axis to hinge axis
(deg) Percentage Progress
GLU-196
TRP-197
6.8
6.9
8.5
-3.0
75.1
73.2
36.1
TRP-197
TYR-198
8.3
8.2
-4.1
5.8
40.5
39.2
-4.4
TYR-198
TYR-199
7.5
7.4
6.9
-3.7
112.4
112.4
17.9
TYR-199
GLU-200
4.5
4.3
-3.5
5.6
115.3
117.8
-84.6
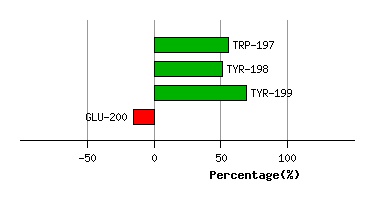
Graph shows rotational transition at bending residues and can be used
to identify hinge bending residues.
Probably only informative for interdomain rotations greater than 20 degrees
Residue
iResidue
i+1Distance of hinge axis to residue i in
(A) Distance of hinge axis to residue i in
(A) Change in
(deg) Change in
(deg) Angle of psi(i) axis to hinge axis
(deg) Angle of psi(i) axis to hinge axis
(deg) Percentage Progress
TYR-222
ASP-223
11.7
11.4
-0.2
172.6
82.3
68.3
994.4
ASP-223
LYS-224
10.1
10.0
78.6
2.9
125.6
122.4
-602.0
LYS-224
SER-225
7.9
7.7
4.5
-5.1
151.8
153.0
41.0
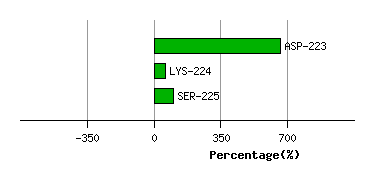
Graph shows rotational transition at bending residues and can be used
to identify hinge bending residues.
Probably only informative for interdomain rotations greater than 20 degrees
Residue
iResidue
i+1Distance of hinge axis to residue i in
(A) Distance of hinge axis to residue i in
(A) Change in
(deg) Change in
(deg) Angle of psi(i) axis to hinge axis
(deg) Angle of psi(i) axis to hinge axis
(deg) Percentage Progress
ILE-226
VAL-227
7.0
6.6
7.3
-7.4
11.6
11.7
-9.8
VAL-227
ASP-228
6.4
6.1
3.1
-3.7
73.2
76.6
47.1
ASP-228
SER-229
9.5
9.3
-2.3
2.1
158.7
156.3
6.1
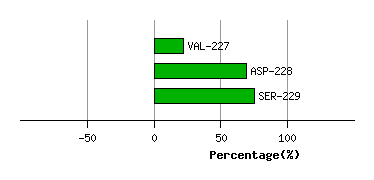
Graph shows rotational transition at bending residues and can be used
to identify hinge bending residues.
Probably only informative for interdomain rotations greater than 20 degrees
Residue
iResidue
i+1Distance of hinge axis to residue i in
(A) Distance of hinge axis to residue i in
(A) Change in
(deg) Change in
(deg) Angle of psi(i) axis to hinge axis
(deg) Angle of psi(i) axis to hinge axis
(deg) Percentage Progress
ILE-337
MET-338
11.3
11.0
-2.8
4.9
54.9
55.3
17.4
MET-338
GLU-339
8.1
7.9
-9.1
-9.3
8.1
5.8
385.6
GLU-339
GLY-340
9.7
9.4
31.4
-3.7
121.5
109.3
-268.3
GLY-340
PHE-341
9.7
9.7
-19.5
-6.7
99.0
87.4
-54.1
PHE-341
TYR-342
6.5
6.3
4.6
2.1
99.8
103.4
15.6
TYR-342
VAL-343
2.8
2.7
12.5
-14.4
20.7
22.5
-8.6
VAL-343
VAL-344
1.4
1.1
4.3
-5.6
85.9
83.3
67.0
VAL-343
VAL-344
1.4
1.1
4.3
-5.6
85.9
83.3
67.0
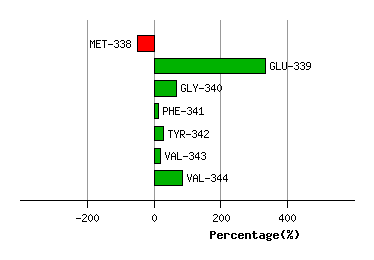
Graph shows rotational transition at bending residues and can be used
to identify hinge bending residues.
Probably only informative for interdomain rotations greater than 20 degrees
Residue
iResidue
i+1Distance of hinge axis to residue i in
(A) Distance of hinge axis to residue i in
(A) Change in
(deg) Change in
(deg) Angle of psi(i) axis to hinge axis
(deg) Angle of psi(i) axis to hinge axis
(deg) Percentage Progress
VAL-343
VAL-344
1.4
1.1
4.3
-5.6
85.9
83.3
67.0
VAL-343
VAL-344
1.4
1.1
4.3
-5.6
85.9
83.3
67.0
VAL-344
PHE-345
2.3
2.6
-3.8
-0.3
159.9
159.6
-53.7
PHE-345
ASP-346
4.0
4.2
2.5
-3.1
80.8
82.5
26.5
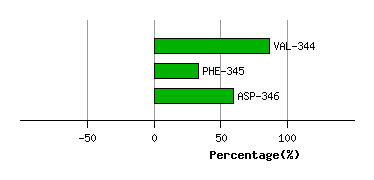
Graph shows rotational transition at bending residues and can be used
to identify hinge bending residues.
Probably only informative for interdomain rotations greater than 20 degrees
Residue
iResidue
i+1Distance of hinge axis to residue i in
(A) Distance of hinge axis to residue i in
(A) Change in
(deg) Change in
(deg) Angle of psi(i) axis to hinge axis
(deg) Angle of psi(i) axis to hinge axis
(deg) Percentage Progress
ARG-349
LYS-350
10.3
10.5
3.7
-3.7
127.4
124.0
34.0
LYS-350
ARG-351
7.3
7.4
3.1
-6.8
78.3
74.6
12.3
ARG-351
ILE-352
5.1
5.3
-0.6
-5.1
137.2
143.5
-39.3
ILE-352
GLY-353
2.4
2.8
-1.0
3.3
123.6
122.9
-24.3
GLY-353
PHE-354
4.1
4.4
5.6
-4.4
59.8
62.4
36.4
GLY-353
PHE-354
4.1
4.4
5.6
-4.4
59.8
62.4
36.4
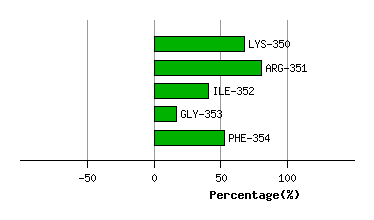
Graph shows rotational transition at bending residues and can be used
to identify hinge bending residues.
Probably only informative for interdomain rotations greater than 20 degrees
Residue
iResidue
i+1Distance of hinge axis to residue i in
(A) Distance of hinge axis to residue i in
(A) Change in
(deg) Change in
(deg) Angle of psi(i) axis to hinge axis
(deg) Angle of psi(i) axis to hinge axis
(deg) Percentage Progress
GLY-353
PHE-354
4.1
4.4
5.6
-4.4
59.8
62.4
36.4
GLY-353
PHE-354
4.1
4.4
5.6
-4.4
59.8
62.4
36.4
PHE-354
ALA-355
5.2
5.3
-2.1
2.8
136.2
135.6
-114.0
ALA-355
VAL-356
6.8
7.0
-12.4
16.8
123.5
120.2
57.2
VAL-356
SER-357
8.3
8.4
8.5
-2.5
46.0
46.2
113.8
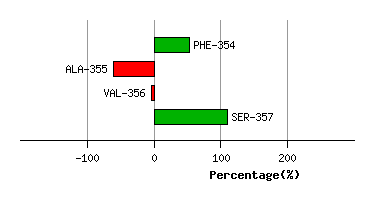
Graph shows rotational transition at bending residues and can be used
to identify hinge bending residues.
Probably only informative for interdomain rotations greater than 20 degrees
Residue
iResidue
i+1Distance of hinge axis to residue i in
(A) Distance of hinge axis to residue i in
(A) Change in
(deg) Change in
(deg) Angle of psi(i) axis to hinge axis
(deg) Angle of psi(i) axis to hinge axis
(deg) Percentage Progress
CYS-359
HIS-360
7.4
7.4
-33.8
11.1
50.8
55.5
163.1
HIS-360
VAL-361
10.3
10.3
9.0
1.8
63.5
52.5
61.4
VAL-361
HIS-362
13.8
13.8
38.9
-5.9
91.3
96.5
-174.7
HIS-362
ASP-363
15.7
15.9
24.3
-18.0
89.0
101.6
39.7
ASP-363
GLU-364
19.4
19.5
-1.0
1.1
128.8
134.1
78.2
GLU-364
PHE-365
21.8
21.9
10.7
-8.7
113.9
102.8
-69.9
PHE-365
ARG-366
23.2
23.0
-12.6
10.2
35.8
43.7
-31.6
ARG-366
THR-367
20.8
20.9
-12.0
21.1
102.2
97.5
-34.0
THR-367
ALA-368
17.1
17.5
-6.0
13.0
29.8
28.5
-47.0
ALA-368
ALA-369
14.4
14.7
17.1
-7.4
91.9
98.4
86.7
ALA-369
VAL-370
13.5
13.9
-11.8
2.0
33.3
37.9
130.5
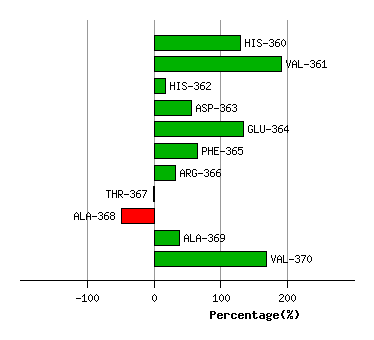
Graph shows rotational transition at bending residues and can be used
to identify hinge bending residues.
Probably only informative for interdomain rotations greater than 20 degrees