Nadph: Adrenodoxin Oxidoreductase
(All numbering and residues are taken from first PDB file)
![]()
![]()
Bending Residue Dihedral Analysis
Residue
iResidue
i+1Distance of hinge axis to residue i in
(A) Distance of hinge axis to residue i in
(A) Change in
(deg) Change in
(deg) Angle of psi(i) axis to hinge axis
(deg) Angle of psi(i) axis to hinge axis
(deg) Percentage Progress
ILE-36
TYR-37
22.3
22.1
4.6
-4.0
25.2
22.6
-65.6
TYR-37
GLU-38
23.8
23.6
-3.1
-0.4
131.6
133.7
-17.3
GLU-38
LYS-39
21.7
21.6
10.1
-6.0
25.2
24.6
-64.9
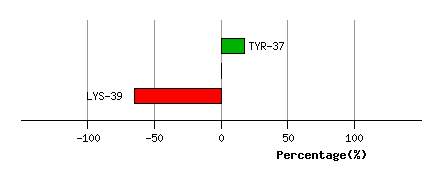
Graph shows rotational transition at bending residues and can be used
to identify hinge bending residues.
Probably only informative for interdomain rotations greater than 20 degrees
Residue
iResidue
i+1Distance of hinge axis to residue i in
(A) Distance of hinge axis to residue i in
(A) Change in
(deg) Change in
(deg) Angle of psi(i) axis to hinge axis
(deg) Angle of psi(i) axis to hinge axis
(deg) Percentage Progress
LEU-41
VAL-42
17.8
17.8
10.3
-8.3
38.0
42.6
0.5
VAL-42
PRO-43
15.0
14.8
-4.3
5.4
120.3
119.2
214.5
PRO-43
PHE-44
15.0
14.8
-6.2
12.1
84.7
82.4
-11.1
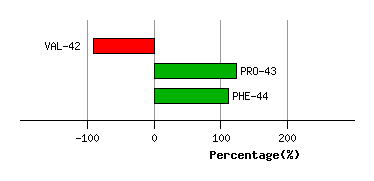
Graph shows rotational transition at bending residues and can be used
to identify hinge bending residues.
Probably only informative for interdomain rotations greater than 20 degrees
Residue
iResidue
i+1Distance of hinge axis to residue i in
(A) Distance of hinge axis to residue i in
(A) Change in
(deg) Change in
(deg) Angle of psi(i) axis to hinge axis
(deg) Angle of psi(i) axis to hinge axis
(deg) Percentage Progress
LEU-46
VAL-47
16.1
16.1
0.4
-1.6
110.5
113.7
9.9
VAL-47
ARG-48
13.2
13.1
0.0
2.9
51.9
50.3
-36.6
ARG-48
PHE-49
11.0
11.0
0.2
-4.7
19.0
20.8
-25.3
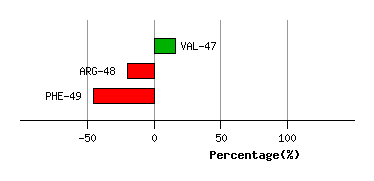
Graph shows rotational transition at bending residues and can be used
to identify hinge bending residues.
Probably only informative for interdomain rotations greater than 20 degrees
Residue
iResidue
i+1Distance of hinge axis to residue i in
(A) Distance of hinge axis to residue i in
(A) Change in
(deg) Change in
(deg) Angle of psi(i) axis to hinge axis
(deg) Angle of psi(i) axis to hinge axis
(deg) Percentage Progress
GLU-57
VAL-58
10.2
10.3
7.1
-9.4
75.0
77.3
37.5
VAL-58
LYS-59
12.1
12.2
1.8
4.0
82.3
78.9
77.7
LYS-59
ASN-60
9.3
9.4
10.3
-12.0
35.6
32.8
-167.3
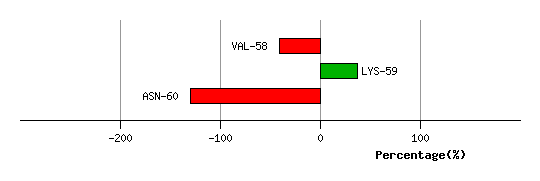
Graph shows rotational transition at bending residues and can be used
to identify hinge bending residues.
Probably only informative for interdomain rotations greater than 20 degrees
Residue
iResidue
i+1Distance of hinge axis to residue i in
(A) Distance of hinge axis to residue i in
(A) Change in
(deg) Change in
(deg) Angle of psi(i) axis to hinge axis
(deg) Angle of psi(i) axis to hinge axis
(deg) Percentage Progress
LEU-100
SER-101
28.6
28.8
-3.4
5.4
95.1
95.0
109.3
SER-101
TYR-102
25.3
25.4
5.2
-4.3
25.4
23.5
-53.2
TYR-102
GLY-103
24.9
25.1
-8.0
5.5
124.9
125.6
51.8
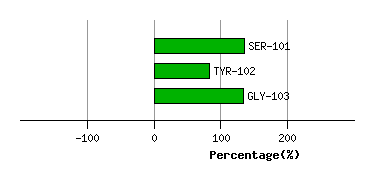
Graph shows rotational transition at bending residues and can be used
to identify hinge bending residues.
Probably only informative for interdomain rotations greater than 20 degrees
Residue
iResidue
i+1Distance of hinge axis to residue i in
(A) Distance of hinge axis to residue i in
(A) Change in
(deg) Change in
(deg) Angle of psi(i) axis to hinge axis
(deg) Angle of psi(i) axis to hinge axis
(deg) Percentage Progress
ARG-334
PRO-335
31.6
31.4
-1.3
7.6
135.9
131.4
149.4
PRO-335
ILE-336
34.0
33.7
35.8
-38.2
95.2
93.8
-63.8
ILE-336
ASP-337
31.9
32.1
-9.4
-2.6
89.4
81.5
-188.4
ASP-337
PRO-338
35.2
35.3
-14.6
3.2
88.0
95.1
-179.3
PRO-338
SER-339
38.8
38.7
3.4
4.6
25.9
36.3
-29.8
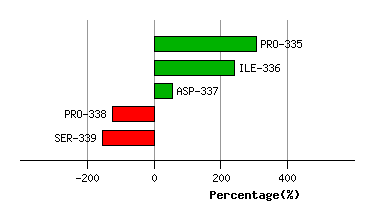
Graph shows rotational transition at bending residues and can be used
to identify hinge bending residues.
Probably only informative for interdomain rotations greater than 20 degrees
Residue
iResidue
i+1Distance of hinge axis to residue i in
(A) Distance of hinge axis to residue i in
(A) Change in
(deg) Change in
(deg) Angle of psi(i) axis to hinge axis
(deg) Angle of psi(i) axis to hinge axis
(deg) Percentage Progress
PRO-341
PHE-342
39.1
39.3
-6.2
-14.9
66.1
61.6
309.5
PHE-342
ASP-343
37.8
37.9
-13.8
6.3
79.5
68.5
-32.5
ASP-343
PRO-344
38.7
39.0
12.9
-19.9
146.9
142.0
154.1
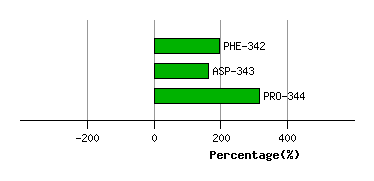
Graph shows rotational transition at bending residues and can be used
to identify hinge bending residues.
Probably only informative for interdomain rotations greater than 20 degrees
Residue
iResidue
i+1Distance of hinge axis to residue i in
(A) Distance of hinge axis to residue i in
(A) Change in
(deg) Change in
(deg) Angle of psi(i) axis to hinge axis
(deg) Angle of psi(i) axis to hinge axis
(deg) Percentage Progress
GLY-347
VAL-348
34.4
34.2
2.1
-5.7
140.9
147.8
20.1
VAL-348
VAL-349
33.6
33.9
-7.6
7.2
69.2
72.0
147.6
VAL-349
PRO-350
34.5
34.9
-1.4
-6.2
42.4
44.5
252.0
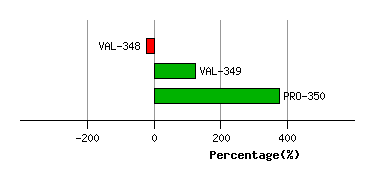
Graph shows rotational transition at bending residues and can be used
to identify hinge bending residues.
Probably only informative for interdomain rotations greater than 20 degrees
Residue
iResidue
i+1Distance of hinge axis to residue i in
(A) Distance of hinge axis to residue i in
(A) Change in
(deg) Change in
(deg) Angle of psi(i) axis to hinge axis
(deg) Angle of psi(i) axis to hinge axis
(deg) Percentage Progress
ASN-351
MET-352
36.5
36.9
8.1
5.6
51.3
44.9
133.6
MET-352
GLU-353
37.1
37.4
-1.6
-9.5
134.0
127.2
-214.6
GLU-353
GLY-354
34.0
34.1
6.5
-3.6
97.2
96.3
121.5
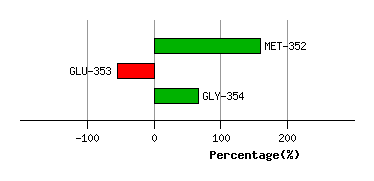
Graph shows rotational transition at bending residues and can be used
to identify hinge bending residues.
Probably only informative for interdomain rotations greater than 20 degrees
Residue
iResidue
i+1Distance of hinge axis to residue i in
(A) Distance of hinge axis to residue i in
(A) Change in
(deg) Change in
(deg) Angle of psi(i) axis to hinge axis
(deg) Angle of psi(i) axis to hinge axis
(deg) Percentage Progress
ASP-431
ALA-432
8.9
9.1
-1.3
0.7
96.3
98.7
-101.1
ALA-432
GLU-433
9.4
9.8
1.8
-5.0
18.0
17.7
-192.9
GLU-433
GLU-434
10.3
10.7
10.3
-1.5
62.2
64.1
309.6
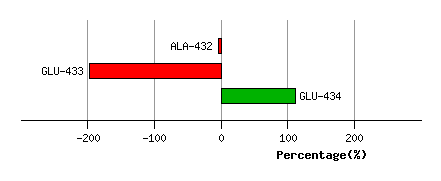
Graph shows rotational transition at bending residues and can be used
to identify hinge bending residues.
Probably only informative for interdomain rotations greater than 20 degrees
Residue
iResidue
i+1Distance of hinge axis to residue i in
(A) Distance of hinge axis to residue i in
(A) Change in
(deg) Change in
(deg) Angle of psi(i) axis to hinge axis
(deg) Angle of psi(i) axis to hinge axis
(deg) Percentage Progress
VAL-435
SER-436
5.2
6.0
-4.3
-5.4
65.1
62.1
440.1
SER-436
ARG-437
8.3
9.1
16.9
-0.6
161.4
164.4
-569.1
ARG-437
GLY-438
7.3
7.8
-24.9
17.4
83.6
80.7
99.4
GLY-438
GLN-439
4.6
5.0
4.6
8.0
104.0
102.4
2.4
GLY-438
GLN-439
4.6
5.0
4.6
8.0
104.0
102.4
2.4
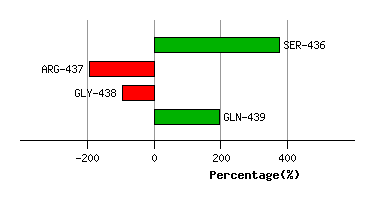
Graph shows rotational transition at bending residues and can be used
to identify hinge bending residues.
Probably only informative for interdomain rotations greater than 20 degrees
Residue
iResidue
i+1Distance of hinge axis to residue i in
(A) Distance of hinge axis to residue i in
(A) Change in
(deg) Change in
(deg) Angle of psi(i) axis to hinge axis
(deg) Angle of psi(i) axis to hinge axis
(deg) Percentage Progress
GLY-438
GLN-439
4.6
5.0
4.6
8.0
104.0
102.4
2.4
GLY-438
GLN-439
4.6
5.0
4.6
8.0
104.0
102.4
2.4
GLN-439
ALA-440
7.6
8.1
7.8
-22.4
39.8
43.8
-379.6
ALA-440
SER-441
9.4
9.6
-2.3
9.4
114.3
111.5
273.3
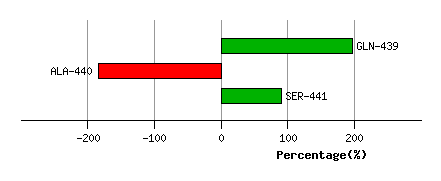
Graph shows rotational transition at bending residues and can be used
to identify hinge bending residues.
Probably only informative for interdomain rotations greater than 20 degrees
Residue
iResidue
i+1Distance of hinge axis to residue i in
(A) Distance of hinge axis to residue i in
(A) Change in
(deg) Change in
(deg) Angle of psi(i) axis to hinge axis
(deg) Angle of psi(i) axis to hinge axis
(deg) Percentage Progress
ARG-445
GLU-446
2.0
2.3
-1.0
6.0
17.5
13.9
-24.4
GLU-446
LYS-447
3.3
3.5
7.6
-7.6
86.8
84.5
43.2
LYS-447
LEU-448
6.3
6.3
-2.3
2.4
47.1
51.9
20.2
LEU-448
LEU-449
9.5
9.7
7.2
-12.2
112.9
112.3
-81.3
LEU-449
ASP-450
10.9
11.2
21.0
-30.0
110.9
112.2
9.7
ASP-450
PRO-451
13.8
14.5
-0.4
3.4
138.1
135.3
-18.2
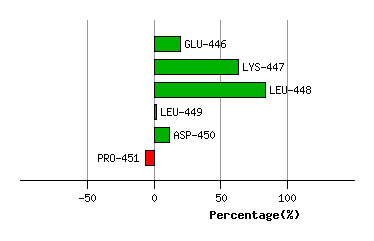
Graph shows rotational transition at bending residues and can be used
to identify hinge bending residues.
Probably only informative for interdomain rotations greater than 20 degrees
Residue
iResidue
i+1Distance of hinge axis to residue i in
(A) Distance of hinge axis to residue i in
(A) Change in
(deg) Change in
(deg) Angle of psi(i) axis to hinge axis
(deg) Angle of psi(i) axis to hinge axis
(deg) Percentage Progress
GLN-452
GLU-453
18.6
19.6
1.1
2.0
65.7
73.1
216.8
GLU-453
MET-454
16.2
17.3
-18.5
15.1
171.6
173.7
-208.3
MET-454
LEU-455
15.8
16.5
6.0
-4.3
63.0
63.0
33.3
LEU-455
ARG-456
19.5
20.2
5.0
-11.6
92.6
95.1
20.6
ARG-456
LEU-457
20.0
20.8
-1.0
6.3
138.0
129.8
44.8
LEU-457
LEU-458
17.8
18.4
7.8
1.2
26.9
21.2
218.9
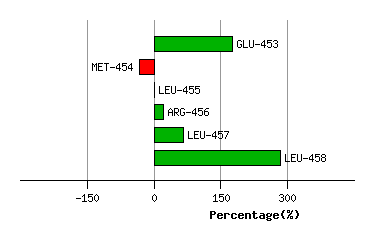
Graph shows rotational transition at bending residues and can be used
to identify hinge bending residues.
Probably only informative for interdomain rotations greater than 20 degrees