Thymidylate Synthase
(All numbering and residues are taken from first PDB file)
![]()
![]()
Bending Residue Dihedral Analysis
Residue
iResidue
i+1Distance of hinge axis to residue i in
(A) Distance of hinge axis to residue i in
(A) Change in
(deg) Change in
(deg) Angle of psi(i) axis to hinge axis
(deg) Angle of psi(i) axis to hinge axis
(deg) Percentage Progress
ILE-55
ILE-56
23.3
23.4
-1.2
2.4
68.6
70.3
35.0
ILE-56
HIS-57
21.3
21.3
1.0
-6.7
84.0
82.5
-112.6
HIS-57
GLU-58
24.1
24.1
5.2
-1.0
22.3
17.9
76.8
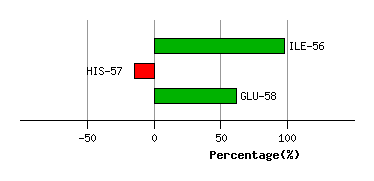
Graph shows rotational transition at bending residues and can be used
to identify hinge bending residues.
Probably only informative for interdomain rotations greater than 20 degrees
Residue
iResidue
i+1Distance of hinge axis to residue i in
(A) Distance of hinge axis to residue i in
(A) Change in
(deg) Change in
(deg) Angle of psi(i) axis to hinge axis
(deg) Angle of psi(i) axis to hinge axis
(deg) Percentage Progress
LEU-119
LYS-120
6.3
6.3
-5.8
5.5
132.2
126.2
84.3
LYS-120
ASN-121
8.5
8.2
-2.7
9.5
68.5
60.5
-259.0
ASN-121
ASP-122
10.9
10.4
-9.6
-0.9
33.5
37.7
224.8
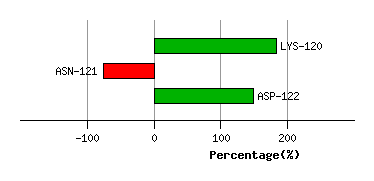
Graph shows rotational transition at bending residues and can be used
to identify hinge bending residues.
Probably only informative for interdomain rotations greater than 20 degrees
Residue
iResidue
i+1Distance of hinge axis to residue i in
(A) Distance of hinge axis to residue i in
(A) Change in
(deg) Change in
(deg) Angle of psi(i) axis to hinge axis
(deg) Angle of psi(i) axis to hinge axis
(deg) Percentage Progress
ASP-124
SER-125
5.0
4.2
-7.2
5.3
144.5
140.6
27.3
SER-125
ARG-126
5.5
5.2
-8.6
10.1
112.0
107.9
-59.1
ARG-126
ARG-127
3.4
3.4
-16.4
31.0
103.6
98.9
-45.7
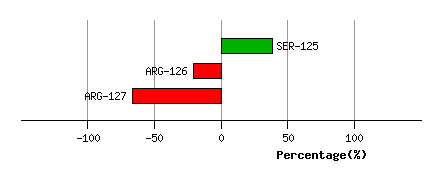
Graph shows rotational transition at bending residues and can be used
to identify hinge bending residues.
Probably only informative for interdomain rotations greater than 20 degrees
Residue
iResidue
i+1Distance of hinge axis to residue i in
(A) Distance of hinge axis to residue i in
(A) Change in
(deg) Change in
(deg) Angle of psi(i) axis to hinge axis
(deg) Angle of psi(i) axis to hinge axis
(deg) Percentage Progress
ALA-148
PHE-149
19.1
19.1
-9.5
3.7
90.3
90.4
387.4
PHE-149
PHE-150
15.3
15.4
-12.6
5.1
117.9
123.7
-79.7
PHE-150
GLN-151
12.2
12.6
8.9
-16.9
87.7
88.2
120.2
GLN-151
PHE-152
8.4
8.8
-6.0
-1.4
140.5
141.6
-231.4
PHE-152
TYR-153
5.8
6.2
-3.0
3.2
73.1
70.4
125.5
TYR-153
VAL-154
2.4
2.9
4.2
-7.7
36.7
31.9
-73.3
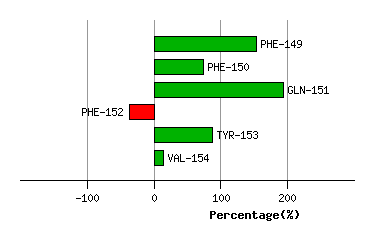
Graph shows rotational transition at bending residues and can be used
to identify hinge bending residues.
Probably only informative for interdomain rotations greater than 20 degrees
Residue
iResidue
i+1Distance of hinge axis to residue i in
(A) Distance of hinge axis to residue i in
(A) Change in
(deg) Change in
(deg) Angle of psi(i) axis to hinge axis
(deg) Angle of psi(i) axis to hinge axis
(deg) Percentage Progress
CYS-161
GLN-162
8.5
9.0
0.0
4.4
52.4
50.6
-112.3
GLN-162
LEU-163
10.7
11.1
1.7
7.3
74.8
77.0
104.4
LEU-163
TYR-164
13.9
14.3
-5.9
8.4
144.3
150.4
-202.1
TYR-164
GLN-165
15.9
16.0
-8.9
9.1
79.6
78.2
-21.5
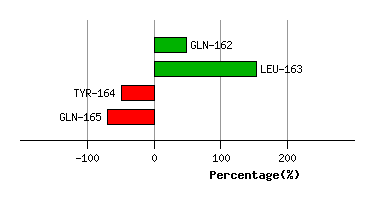
Graph shows rotational transition at bending residues and can be used
to identify hinge bending residues.
Probably only informative for interdomain rotations greater than 20 degrees
Residue
iResidue
i+1Distance of hinge axis to residue i in
(A) Distance of hinge axis to residue i in
(A) Change in
(deg) Change in
(deg) Angle of psi(i) axis to hinge axis
(deg) Angle of psi(i) axis to hinge axis
(deg) Percentage Progress
ILE-231
ILE-232
12.6
12.5
-5.4
7.1
93.0
92.6
-46.2
ILE-232
LYS-233
11.0
11.1
22.8
-28.4
151.7
146.6
-18.7
LYS-233
ARG-234
11.1
10.8
13.5
-14.4
93.8
97.0
86.1
ARG-234
LYS-235
10.5
10.3
-15.7
17.7
146.8
152.8
-18.1
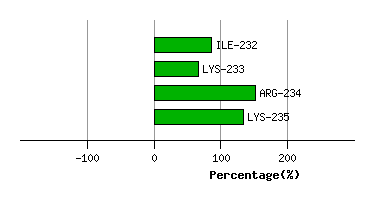
Graph shows rotational transition at bending residues and can be used
to identify hinge bending residues.
Probably only informative for interdomain rotations greater than 20 degrees
Residue
iResidue
i+1Distance of hinge axis to residue i in
(A) Distance of hinge axis to residue i in
(A) Change in
(deg) Change in
(deg) Angle of psi(i) axis to hinge axis
(deg) Angle of psi(i) axis to hinge axis
(deg) Percentage Progress
GLU-245
ASP-246
19.0
18.9
-10.8
4.5
85.8
85.8
38.8
ASP-246
PHE-247
15.5
15.3
-0.2
-0.4
71.8
70.7
2.9
PHE-247
GLU-248
16.0
15.9
-9.4
20.4
120.9
124.1
120.8
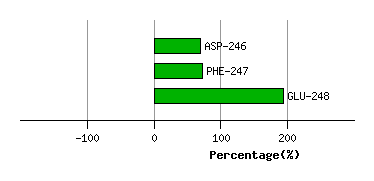
Graph shows rotational transition at bending residues and can be used
to identify hinge bending residues.
Probably only informative for interdomain rotations greater than 20 degrees