Tricorn Protease Interacting Factor F3
(All numbering and residues are taken from first PDB file)
![]()
![]()
Bending Residue Dihedral Analysis
Residue
iResidue
i+1Distance of hinge axis to residue i in
(A) Distance of hinge axis to residue i in
(A) Change in
(deg) Change in
(deg) Angle of psi(i) axis to hinge axis
(deg) Angle of psi(i) axis to hinge axis
(deg) Percentage Progress
PRO-526
GLU-527
9.9
10.2
7.4
-11.0
132.9
133.7
71.0
GLU-527
THR-528
12.7
12.8
17.8
-8.4
146.4
144.8
-181.5
THR-528
TYR-529
13.9
14.0
2.2
-2.2
124.4
125.8
45.6
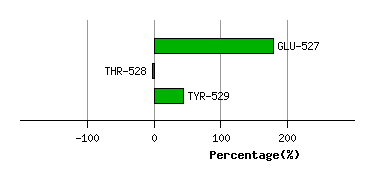
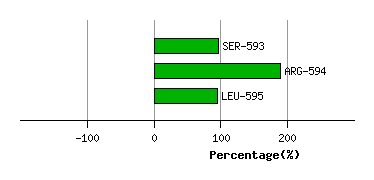
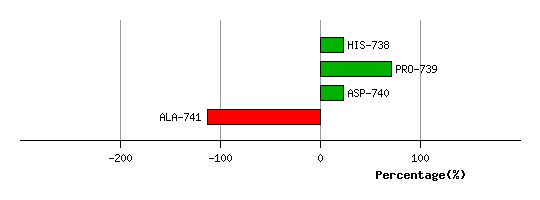
Graph shows rotational transition at bending residues and can be used
to identify hinge bending residues.
Probably only informative for interdomain rotations greater than 20 degrees
Residue
iResidue
i+1Distance of hinge axis to residue i in
(A) Distance of hinge axis to residue i in
(A) Change in
(deg) Change in
(deg) Angle of psi(i) axis to hinge axis
(deg) Angle of psi(i) axis to hinge axis
(deg) Percentage Progress
GLN-531
ARG-532
13.1
12.9
5.6
-11.9
41.2
38.4
-70.4
ARG-532
ILE-533
12.3
12.3
11.5
-6.9
61.0
60.8
92.7
ILE-533
ARG-534
8.5
8.6
-4.5
8.6
128.4
127.3
95.0
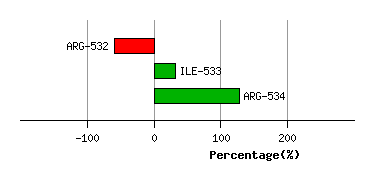
Graph shows rotational transition at bending residues and can be used
to identify hinge bending residues.
Probably only informative for interdomain rotations greater than 20 degrees
Residue
iResidue
i+1Distance of hinge axis to residue i in
(A) Distance of hinge axis to residue i in
(A) Change in
(deg) Change in
(deg) Angle of psi(i) axis to hinge axis
(deg) Angle of psi(i) axis to hinge axis
(deg) Percentage Progress
MET-552
GLU-553
1.6
1.7
1.2
-0.2
59.5
57.4
10.4
GLU-553
TYR-554
4.9
4.9
-3.6
-1.8
152.4
154.4
-73.7
TYR-554
LEU-555
4.3
4.2
5.0
-0.1
49.3
52.3
80.8
LEU-555
ARG-556
1.0
1.0
0.7
1.5
111.3
113.8
-36.2
LEU-555
ARG-556
1.0
1.0
0.7
1.5
111.3
113.8
-36.2
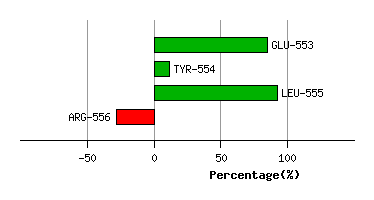
Graph shows rotational transition at bending residues and can be used
to identify hinge bending residues.
Probably only informative for interdomain rotations greater than 20 degrees
Residue
iResidue
i+1Distance of hinge axis to residue i in
(A) Distance of hinge axis to residue i in
(A) Change in
(deg) Change in
(deg) Angle of psi(i) axis to hinge axis
(deg) Angle of psi(i) axis to hinge axis
(deg) Percentage Progress
LEU-555
ARG-556
1.0
1.0
0.7
1.5
111.3
113.8
-36.2
LEU-555
ARG-556
1.0
1.0
0.7
1.5
111.3
113.8
-36.2
ARG-556
MET-557
4.6
4.7
-9.4
5.3
31.2
28.5
71.2
MET-557
LEU-558
5.5
5.5
-0.9
2.0
36.7
38.9
7.1
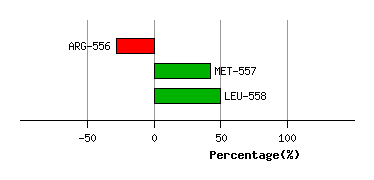
Graph shows rotational transition at bending residues and can be used
to identify hinge bending residues.
Probably only informative for interdomain rotations greater than 20 degrees
Residue
iResidue
i+1Distance of hinge axis to residue i in
(A) Distance of hinge axis to residue i in
(A) Change in
(deg) Change in
(deg) Angle of psi(i) axis to hinge axis
(deg) Angle of psi(i) axis to hinge axis
(deg) Percentage Progress
PHE-562
ASP-563
6.5
6.6
2.3
-1.9
125.7
122.9
-10.5
ASP-563
ASP-564
8.4
8.5
-6.2
1.9
40.5
38.2
60.8
ASP-564
ASP-565
10.9
11.0
10.7
-7.2
139.8
138.1
-57.4
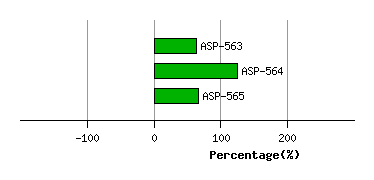
Graph shows rotational transition at bending residues and can be used
to identify hinge bending residues.
Probably only informative for interdomain rotations greater than 20 degrees
Residue
iResidue
i+1Distance of hinge axis to residue i in
(A) Distance of hinge axis to residue i in
(A) Change in
(deg) Change in
(deg) Angle of psi(i) axis to hinge axis
(deg) Angle of psi(i) axis to hinge axis
(deg) Percentage Progress
ALA-568
PHE-569
10.2
10.2
-11.3
5.3
127.7
132.1
-94.4
PHE-569
CYS-570
6.6
6.7
-3.2
3.7
123.0
121.4
19.6
CYS-570
ARG-571
7.6
7.7
4.4
-0.2
42.7
44.0
81.7
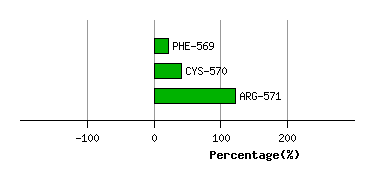
Graph shows rotational transition at bending residues and can be used
to identify hinge bending residues.
Probably only informative for interdomain rotations greater than 20 degrees
Residue
iResidue
i+1Distance of hinge axis to residue i in
(A) Distance of hinge axis to residue i in
(A) Change in
(deg) Change in
(deg) Angle of psi(i) axis to hinge axis
(deg) Angle of psi(i) axis to hinge axis
(deg) Percentage Progress
LEU-585
LYS-586
6.7
6.5
2.5
1.9
67.2
65.3
24.6
LYS-586
ILE-587
10.1
9.9
-2.8
0.3
159.4
158.8
-43.3
ILE-587
ALA-588
10.7
10.6
0.5
2.0
52.1
50.7
29.7
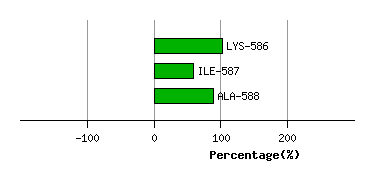
Graph shows rotational transition at bending residues and can be used
to identify hinge bending residues.
Probably only informative for interdomain rotations greater than 20 degrees
Residue
iResidue
i+1Distance of hinge axis to residue i in
(A) Distance of hinge axis to residue i in
(A) Change in
(deg) Change in
(deg) Angle of psi(i) axis to hinge axis
(deg) Angle of psi(i) axis to hinge axis
(deg) Percentage Progress
LEU-589
GLY-590
8.5
8.5
-3.8
3.6
42.5
40.9
3.8
GLY-590
ARG-591
11.2
11.2
1.5
-3.0
156.3
156.9
46.2
ARG-591
VAL-592
9.0
9.0
1.8
-3.1
104.8
107.1
-18.6
VAL-592
SER-593
7.2
7.3
-8.2
8.9
104.4
105.1
28.6
VAL-592
SER-593
7.2
7.3
-8.2
8.9
104.4
105.1
28.6
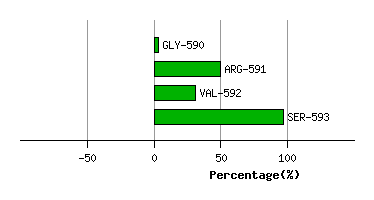
Graph shows rotational transition at bending residues and can be used
to identify hinge bending residues.
Probably only informative for interdomain rotations greater than 20 degrees
Residue
iResidue
i+1Distance of hinge axis to residue i in
(A) Distance of hinge axis to residue i in
(A) Change in
(deg) Change in
(deg) Angle of psi(i) axis to hinge axis
(deg) Angle of psi(i) axis to hinge axis
(deg) Percentage Progress
VAL-592
SER-593
7.2
7.3
-8.2
8.9
104.4
105.1
28.6
VAL-592
SER-593
7.2
7.3
-8.2
8.9
104.4
105.1
28.6
SER-593
ARG-594
10.9
11.0
-2.4
6.9
156.8
155.5
92.1
ARG-594
LEU-595
11.7
11.6
-7.5
1.3
135.5
138.3
-94.1
Graph shows rotational transition at bending residues and can be used
to identify hinge bending residues.
Probably only informative for interdomain rotations greater than 20 degrees
Residue
iResidue
i+1Distance of hinge axis to residue i in
(A) Distance of hinge axis to residue i in
(A) Change in
(deg) Change in
(deg) Angle of psi(i) axis to hinge axis
(deg) Angle of psi(i) axis to hinge axis
(deg) Percentage Progress
ASP-737
HIS-738
6.3
6.2
-5.5
1.5
45.8
43.5
70.2
HIS-738
PRO-739
8.8
8.5
7.1
-10.6
104.0
101.9
48.8
PRO-739
ASP-740
8.0
7.9
18.9
-9.0
111.9
116.6
-48.7
ASP-740
ALA-741
11.2
11.2
-14.6
5.5
133.0
130.8
-135.4
Graph shows rotational transition at bending residues and can be used
to identify hinge bending residues.
Probably only informative for interdomain rotations greater than 20 degrees
Residue
iResidue
i+1Distance of hinge axis to residue i in
(A) Distance of hinge axis to residue i in
(A) Change in
(deg) Change in
(deg) Angle of psi(i) axis to hinge axis
(deg) Angle of psi(i) axis to hinge axis
(deg) Percentage Progress
ALA-765
VAL-766
9.3
9.3
11.4
-12.2
43.9
42.8
11.2
VAL-766
ASN-767
9.1
9.2
6.2
-4.0
82.8
78.0
67.4
ASN-767
ARG-768
5.4
5.5
-2.2
5.3
42.6
43.6
-45.0
ARG-768
LYS-769
4.5
4.6
6.6
-10.8
87.1
86.5
-47.8
LYS-769
LEU-770
7.3
7.5
7.7
-4.5
42.1
36.8
31.9
LEU-770
VAL-771
6.2
6.3
-0.4
-0.6
74.4
76.6
6.8
VAL-771
GLU-772
3.7
3.8
0.8
3.5
126.6
125.7
-21.3
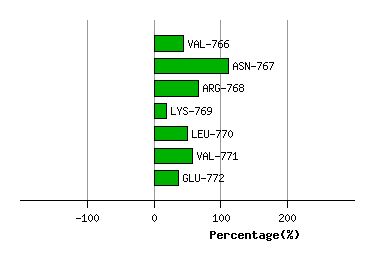
Graph shows rotational transition at bending residues and can be used
to identify hinge bending residues.
Probably only informative for interdomain rotations greater than 20 degrees