Serine/threonine-Protein Kinase Mark1
(All numbering and residues are taken from first PDB file)
![]()
![]()
Bending Residue Dihedral Analysis
Residue
iResidue
i+1Distance of hinge axis to residue i in
(A) Distance of hinge axis to residue i in
(A) Change in
(deg) Change in
(deg) Angle of psi(i) axis to hinge axis
(deg) Angle of psi(i) axis to hinge axis
(deg) Percentage Progress
GLU-130
TYR-131
6.5
6.4
17.5
-23.4
119.3
113.4
-77.2
TYR-131
ALA-132
5.3
5.2
-14.7
17.0
89.0
91.4
54.6
ALA-132
SER-133
3.1
3.1
8.4
-6.4
142.3
142.1
-8.2
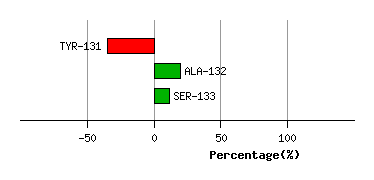
Graph shows rotational transition at bending residues and can be used
to identify hinge bending residues.
Probably only informative for interdomain rotations greater than 20 degrees
Residue
iResidue
i+1Distance of hinge axis to residue i in
(A) Distance of hinge axis to residue i in
(A) Change in
(deg) Change in
(deg) Angle of psi(i) axis to hinge axis
(deg) Angle of psi(i) axis to hinge axis
(deg) Percentage Progress
ALA-192
ASP-193
6.4
6.2
-7.8
-1.0
46.9
44.4
-20.7
ASP-193
PHE-194
9.0
8.7
6.5
-6.9
135.8
135.2
15.9
PHE-194
GLY-195
8.1
7.6
1.2
1.8
145.9
143.2
39.4
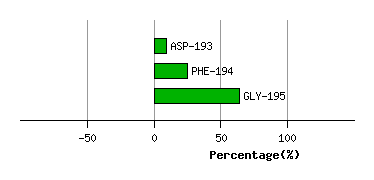
Graph shows rotational transition at bending residues and can be used
to identify hinge bending residues.
Probably only informative for interdomain rotations greater than 20 degrees
Residue
iResidue
i+1Distance of hinge axis to residue i in
(A) Distance of hinge axis to residue i in
(A) Change in
(deg) Change in
(deg) Angle of psi(i) axis to hinge axis
(deg) Angle of psi(i) axis to hinge axis
(deg) Percentage Progress
SER-197
ASN-198
16.5
16.3
16.2
-67.9
151.8
171.6
658.3
ASN-198
GLU-199
18.7
17.6
59.4
0.7
124.5
108.5
-479.8
GLU-199
PHE-200
20.4
20.2
10.7
-5.2
144.4
146.1
-100.5
PHE-200
THR-201
18.1
18.2
-8.6
4.0
60.9
54.2
-21.9
THR-201
VAL-202
16.3
16.5
25.8
-52.5
167.9
156.0
133.5
SER-212
PRO-213
23.6
23.7
7.0
16.5
130.1
119.1
-161.2
PRO-213
PRO-214
21.3
21.5
-4.7
13.8
109.3
103.3
183.9
PRO-214
TYR-215
22.1
22.3
-17.2
-6.7
119.1
118.8
45.5
TYR-215
ALA-216
18.9
18.7
53.7
-66.7
22.7
36.6
-43.3
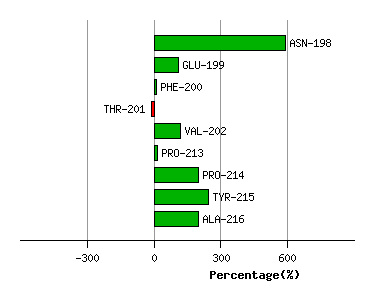
Graph shows rotational transition at bending residues and can be used
to identify hinge bending residues.
Probably only informative for interdomain rotations greater than 20 degrees
Residue
iResidue
i+1Distance of hinge axis to residue i in
(A) Distance of hinge axis to residue i in
(A) Change in
(deg) Change in
(deg) Angle of psi(i) axis to hinge axis
(deg) Angle of psi(i) axis to hinge axis
(deg) Percentage Progress
TYR-316
THR-317
8.2
8.4
-17.8
17.3
63.2
63.0
57.8
THR-317
GLU-318
9.9
10.3
-13.3
19.3
137.6
144.5
35.7
GLU-318
PRO-319
10.7
11.0
-7.0
16.3
99.1
94.5
-30.5
PRO-319
ASP-320
14.0
14.5
8.5
-13.1
92.5
97.6
-52.0
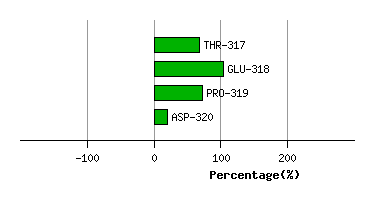
Graph shows rotational transition at bending residues and can be used
to identify hinge bending residues.
Probably only informative for interdomain rotations greater than 20 degrees