T-Lymphoma Invasion And Metastasis Inducing Protein 1
(All numbering and residues are taken from first PDB file)
![]()
![]()
Bending Residue Dihedral Analysis
Residue
iResidue
i+1Distance of hinge axis to residue i in
(A) Distance of hinge axis to residue i in
(A) Change in
(deg) Change in
(deg) Angle of psi(i) axis to hinge axis
(deg) Angle of psi(i) axis to hinge axis
(deg) Percentage Progress
GLU-1239
GLU-1240
4.4
4.4
-1.6
0.3
33.0
33.4
25.0
GLU-1240
PHE-1241
1.9
1.9
1.5
-1.8
98.6
98.7
-9.6
PHE-1241
GLY-1242
1.9
2.0
-3.0
7.5
113.0
113.5
68.7
GLY-1242
ALA-1243
4.4
4.4
-2.6
1.8
52.2
51.5
-5.0
ALA-1243
VAL-1244
6.5
6.5
-2.1
-0.9
86.4
87.5
21.2
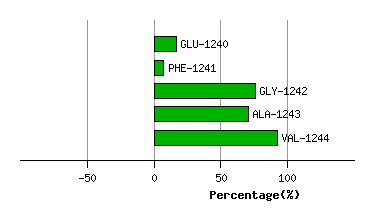
Graph shows rotational transition at bending residues and can be used
to identify hinge bending residues.
Probably only informative for interdomain rotations greater than 20 degrees
Residue
iResidue
i+1Distance of hinge axis to residue i in
(A) Distance of hinge axis to residue i in
(A) Change in
(deg) Change in
(deg) Angle of psi(i) axis to hinge axis
(deg) Angle of psi(i) axis to hinge axis
(deg) Percentage Progress
VAL-1301
LEU-1302
11.7
11.6
-3.1
3.4
129.6
129.9
-12.1
LEU-1302
VAL-1303
11.9
11.8
-3.4
-1.7
137.8
136.1
-50.7
VAL-1303
TYR-1304
9.1
8.9
-5.1
24.3
133.4
129.5
298.0
TYR-1304
LYS-1305
9.0
9.0
20.0
69.2
63.5
74.8
611.2
LYS-1305
ASP-1306
5.9
6.8
138.2
-178.3
45.5
33.4
-708.7
ASP-1306
GLY-1307
6.0
6.1
-27.7
-52.1
103.8
100.0
-290.2
GLY-1307
SER-1308
5.4
4.1
-148.7
55.1
108.4
96.5
-161.6
SER-1308
LYS-1309
7.9
7.6
37.4
94.6
88.0
15.4
1871.0
LYS-1309
GLN-1310
8.0
8.0
152.7
19.8
54.1
58.2
-1878.2
GLN-1310
LYS-1311
7.2
4.9
161.1
-150.9
31.9
106.8
-55.7
LYS-1311
LYS-1312
9.9
6.4
63.8
-127.4
82.6
109.3
385.4
LYS-1312
LYS-1313
12.8
6.8
137.0
31.1
107.4
44.5
976.9
LYS-1313
LEU-1314
11.9
7.2
-9.4
-31.3
145.2
121.8
-555.2
LEU-1314
VAL-1315
11.6
5.7
-6.8
-40.8
97.7
153.2
-564.0
VAL-1315
GLY-1316
14.9
6.2
46.4
-102.6
65.2
50.0
-626.0
GLY-1316
SER-1317
14.4
2.9
42.7
-10.1
27.0
42.6
489.0
SER-1317
HIS-1318
11.9
1.4
-28.0
151.9
103.7
128.6
1297.9
HIS-1318
ARG-1319
12.4
1.0
-99.9
-20.4
124.5
65.0
68.9
ARG-1319
LEU-1320
9.1
4.3
53.4
-8.8
126.8
152.2
-633.7
LEU-1320
SER-1321
6.2
4.3
-43.0
-23.5
34.3
44.4
973.8
SER-1321
ILE-1322
6.9
2.8
-6.3
26.8
66.8
61.2
-211.0
ILE-1322
TYR-1323
4.8
5.4
-81.7
-64.1
8.1
30.9
-3630.5
TYR-1323
GLU-1324
5.1
5.0
-68.7
49.4
64.9
81.5
29.3
GLU-1324
GLU-1325
4.0
8.8
-89.7
16.6
28.2
16.1
1150.1
GLU-1325
TRP-1326
4.8
8.8
51.5
-44.5
111.5
113.2
-51.6
TRP-1326
ASP-1327
5.8
7.7
63.2
-125.0
161.9
155.4
992.2
ASP-1327
PRO-1328
4.4
5.8
26.4
2.4
94.1
95.2
-1.2
PRO-1328
PHE-1329
2.2
2.4
0.5
5.1
119.9
123.2
15.1
PHE-1329
ARG-1330
5.2
5.0
55.0
-38.7
59.3
59.1
202.9
ARG-1330
PHE-1331
8.0
8.3
-91.3
89.3
62.2
50.1
-48.7
PHE-1331
ARG-1332
10.6
11.2
18.4
-19.8
171.6
155.2
14.4
ARG-1332
HIS-1333
11.1
11.4
-20.2
12.7
72.5
62.2
29.0
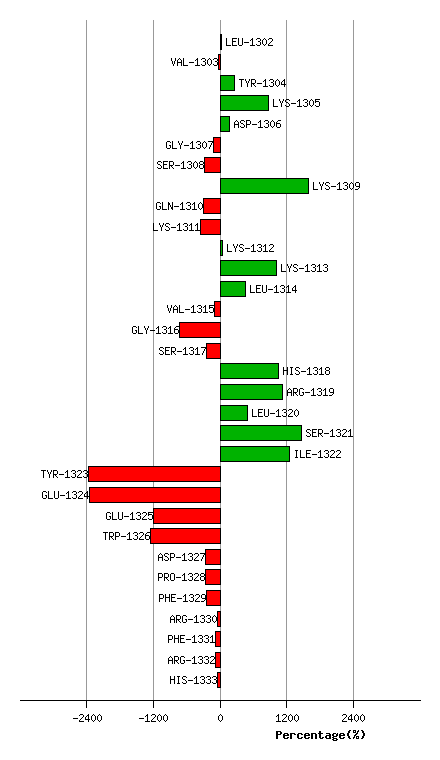
Graph shows rotational transition at bending residues and can be used
to identify hinge bending residues.
Probably only informative for interdomain rotations greater than 20 degrees