Monoclonal Antibody Against The Main Immunogenic Region Of The Human Muscle Acetylcholine Receptor
(All numbering and residues are taken from first PDB file)
![]()
![]()
Bending Residue Dihedral Analysis
Residue
iResidue
i+1Distance of hinge axis to residue i in
(A) Distance of hinge axis to residue i in
(A) Change in
(deg) Change in
(deg) Angle of psi(i) axis to hinge axis
(deg) Angle of psi(i) axis to hinge axis
(deg) Percentage Progress
SER-124
VAL-125
2.0
2.5
-1.9
8.5
166.6
168.5
83.2
VAL-125
TYR-126
3.4
3.8
-5.4
3.6
102.4
99.5
-34.5
TYR-126
PRO-127
5.3
5.3
9.2
-0.5
4.9
5.0
146.0
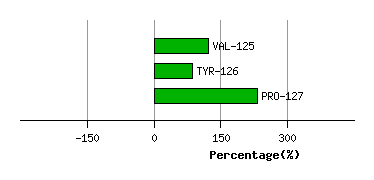
Graph shows rotational transition at bending residues and can be used
to identify hinge bending residues.
Probably only informative for interdomain rotations greater than 20 degrees
Residue
iResidue
i+1Distance of hinge axis to residue i in
(A) Distance of hinge axis to residue i in
(A) Change in
(deg) Change in
(deg) Angle of psi(i) axis to hinge axis
(deg) Angle of psi(i) axis to hinge axis
(deg) Percentage Progress
GLY-143
CYS-144
2.7
3.0
-11.7
17.9
158.6
160.9
83.0
CYS-144
LEU-145
2.5
2.8
11.6
-13.3
58.0
61.7
-24.6
LEU-145
VAL-146
1.8
1.6
0.1
6.2
40.8
37.7
57.1
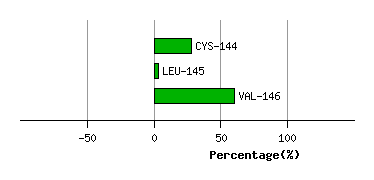
Graph shows rotational transition at bending residues and can be used
to identify hinge bending residues.
Probably only informative for interdomain rotations greater than 20 degrees
Residue
iResidue
i+1Distance of hinge axis to residue i in
(A) Distance of hinge axis to residue i in
(A) Change in
(deg) Change in
(deg) Angle of psi(i) axis to hinge axis
(deg) Angle of psi(i) axis to hinge axis
(deg) Percentage Progress
GLY-148
TYR-149
4.0
4.0
0.0
7.0
76.5
71.3
45.0
TYR-149
PHE-150
5.8
5.8
18.8
-8.6
98.7
102.7
-45.7
PHE-150
PRO-151
9.3
9.4
-8.5
-6.3
74.9
77.9
-60.5
PRO-151
GLU-152
12.0
11.9
10.9
-6.0
18.7
21.2
72.0
GLU-152
PRO-153
12.7
12.7
-3.5
0.3
88.9
86.0
24.6
PRO-153
VAL-154
12.6
12.7
3.6
4.2
92.7
95.3
41.0
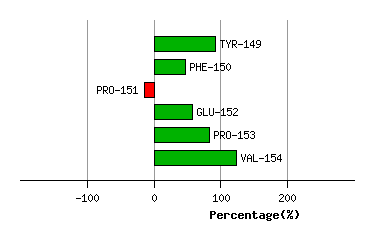
Graph shows rotational transition at bending residues and can be used
to identify hinge bending residues.
Probably only informative for interdomain rotations greater than 20 degrees
Residue
iResidue
i+1Distance of hinge axis to residue i in
(A) Distance of hinge axis to residue i in
(A) Change in
(deg) Change in
(deg) Angle of psi(i) axis to hinge axis
(deg) Angle of psi(i) axis to hinge axis
(deg) Percentage Progress
VAL-156
THR-157
8.1
8.2
-13.7
5.9
19.4
21.2
78.2
THR-157
TRP-158
9.2
9.6
-6.4
1.8
80.2
79.2
2.2
TRP-158
ASN-159
9.0
8.9
-7.2
3.6
69.3
67.5
9.5
ASN-159
SER-160
12.2
12.1
-0.3
-1.3
95.5
92.3
17.0
SER-160
GLY-161
13.9
14.0
-65.9
93.3
40.5
38.7
-315.5
GLY-161
ALA-162
13.0
13.5
-34.7
48.0
24.0
29.3
-150.3
ALA-162
LEU-163
13.6
13.3
140.8
98.5
123.6
117.2
1029.6
LEU-163
SER-164
10.0
11.0
130.8
-138.4
114.0
61.5
-164.1
SER-164
SER-165
8.9
8.8
97.6
-113.5
122.4
123.3
214.0
SER-165
ASP-166
6.0
6.5
-104.1
-158.7
87.1
103.2
151.2
ASP-166
VAL-167
3.6
3.3
-45.1
-13.0
168.2
173.8
-778.9
VAL-167
HIS-168
4.7
4.3
-6.9
10.9
101.0
109.6
-44.7
HIS-168
THR-169
5.1
4.8
29.4
-32.9
0.6
6.4
-28.7
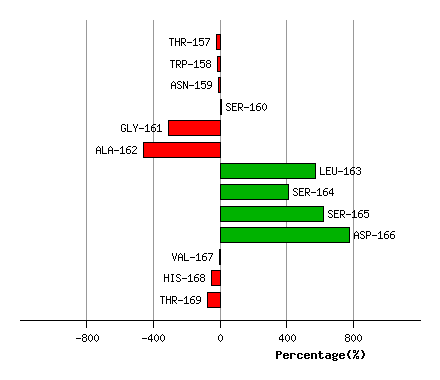
Graph shows rotational transition at bending residues and can be used
to identify hinge bending residues.
Probably only informative for interdomain rotations greater than 20 degrees
Residue
iResidue
i+1Distance of hinge axis to residue i in
(A) Distance of hinge axis to residue i in
(A) Change in
(deg) Change in
(deg) Angle of psi(i) axis to hinge axis
(deg) Angle of psi(i) axis to hinge axis
(deg) Percentage Progress
VAL-173
LEU-174
11.5
11.6
24.9
-1.6
9.7
15.4
346.9
LEU-174
GLN-175
12.2
12.4
10.5
-34.6
68.4
79.8
-158.6
GLN-175
SER-176
12.1
12.0
-5.9
-1.5
171.2
158.9
-110.9
SER-176
GLY-177
13.2
12.1
141.3
-172.1
77.8
69.7
33.6
GLY-177
LEU-178
11.4
11.7
20.3
-16.4
54.2
69.8
-3.3
GLY-177
LEU-178
11.4
11.7
20.3
-16.4
54.2
69.8
-3.3
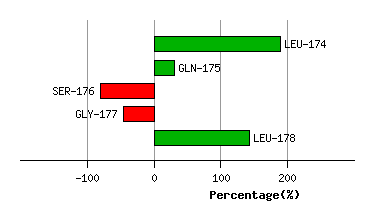
Graph shows rotational transition at bending residues and can be used
to identify hinge bending residues.
Probably only informative for interdomain rotations greater than 20 degrees
Residue
iResidue
i+1Distance of hinge axis to residue i in
(A) Distance of hinge axis to residue i in
(A) Change in
(deg) Change in
(deg) Angle of psi(i) axis to hinge axis
(deg) Angle of psi(i) axis to hinge axis
(deg) Percentage Progress
GLY-177
LEU-178
11.4
11.7
20.3
-16.4
54.2
69.8
-3.3
GLY-177
LEU-178
11.4
11.7
20.3
-16.4
54.2
69.8
-3.3
LEU-178
TYR-179
8.9
8.8
-15.0
13.4
168.5
179.0
-8.0
TYR-179
THR-180
8.6
8.4
-9.2
2.5
110.8
115.4
-78.4
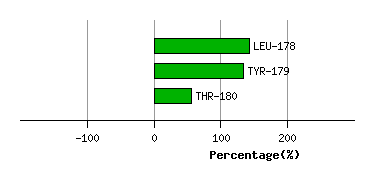
Graph shows rotational transition at bending residues and can be used
to identify hinge bending residues.
Probably only informative for interdomain rotations greater than 20 degrees
Residue
iResidue
i+1Distance of hinge axis to residue i in
(A) Distance of hinge axis to residue i in
(A) Change in
(deg) Change in
(deg) Angle of psi(i) axis to hinge axis
(deg) Angle of psi(i) axis to hinge axis
(deg) Percentage Progress
THR-194
VAL-195
14.4
14.1
25.6
-21.7
86.5
94.2
51.9
VAL-195
THR-196
10.8
10.6
-11.5
12.5
168.1
169.8
-14.9
THR-196
CYS-197
10.0
10.1
10.4
-12.0
81.4
81.9
-41.9
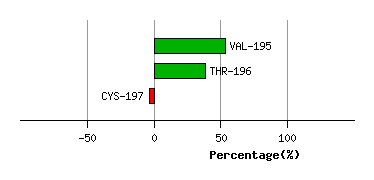
Graph shows rotational transition at bending residues and can be used
to identify hinge bending residues.
Probably only informative for interdomain rotations greater than 20 degrees
Residue
iResidue
i+1Distance of hinge axis to residue i in
(A) Distance of hinge axis to residue i in
(A) Change in
(deg) Change in
(deg) Angle of psi(i) axis to hinge axis
(deg) Angle of psi(i) axis to hinge axis
(deg) Percentage Progress
ASN-198
VAL-199
9.8
10.1
5.9
-8.2
118.1
116.1
-69.1
VAL-199
ALA-200
8.2
8.4
-14.4
7.3
46.3
42.9
137.5
ALA-200
HIS-201
10.7
10.8
-11.5
0.3
60.0
61.2
72.3
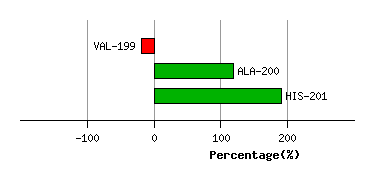
Graph shows rotational transition at bending residues and can be used
to identify hinge bending residues.
Probably only informative for interdomain rotations greater than 20 degrees
Residue
iResidue
i+1Distance of hinge axis to residue i in
(A) Distance of hinge axis to residue i in
(A) Change in
(deg) Change in
(deg) Angle of psi(i) axis to hinge axis
(deg) Angle of psi(i) axis to hinge axis
(deg) Percentage Progress
SER-204
SER-205
11.8
11.6
12.1
6.3
104.3
104.6
-66.1
SER-205
THR-206
14.3
13.8
13.9
2.1
106.0
113.6
-36.1
THR-206
LYS-207
11.7
11.0
-30.8
-0.8
7.6
19.2
442.1
LYS-207
VAL-208
11.8
12.5
-43.8
8.8
85.0
79.0
3.8
VAL-208
ASP-209
9.8
10.9
7.4
9.3
163.4
164.0
-237.4
ASP-209
LYS-210
10.9
11.4
30.4
-29.6
84.8
92.3
-157.4
ASP-209
LYS-210
10.9
11.4
30.4
-29.6
84.8
92.3
-157.4
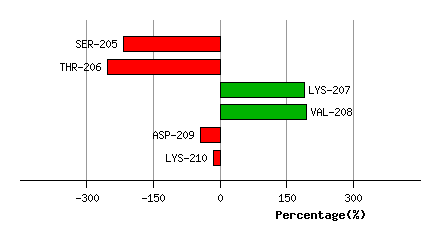
Graph shows rotational transition at bending residues and can be used
to identify hinge bending residues.
Probably only informative for interdomain rotations greater than 20 degrees
Residue
iResidue
i+1Distance of hinge axis to residue i in
(A) Distance of hinge axis to residue i in
(A) Change in
(deg) Change in
(deg) Angle of psi(i) axis to hinge axis
(deg) Angle of psi(i) axis to hinge axis
(deg) Percentage Progress
ASP-209
LYS-210
10.9
11.4
30.4
-29.6
84.8
92.3
-157.4
ASP-209
LYS-210
10.9
11.4
30.4
-29.6
84.8
92.3
-157.4
LYS-210
LYS-211
9.0
9.6
9.5
8.0
28.3
23.2
220.2
LYS-211
LEU-212
11.3
11.4
35.2
-25.3
78.7
78.7
33.4
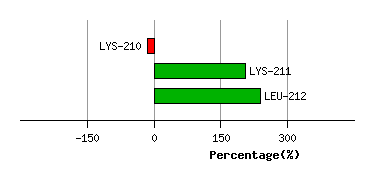
Graph shows rotational transition at bending residues and can be used
to identify hinge bending residues.
Probably only informative for interdomain rotations greater than 20 degrees