Hiv-1 Reverse Transcriptase
(All numbering and residues are taken from first PDB file)
![]()
![]()
Bending Residue Dihedral Analysis
Residue
iResidue
i+1Distance of hinge axis to residue i in
(A) Distance of hinge axis to residue i in
(A) Change in
(deg) Change in
(deg) Angle of psi(i) axis to hinge axis
(deg) Angle of psi(i) axis to hinge axis
(deg) Percentage Progress
ILE-326
ALA-327
5.6
4.9
-6.3
6.6
76.7
74.3
-4.4
ALA-327
GLU-328
5.8
5.2
-5.2
3.0
143.0
136.8
-37.3
GLU-328
ILE-329
9.0
8.6
-33.8
39.6
84.9
87.6
38.3
ILE-329
GLN-330
11.1
10.6
-5.9
16.8
63.0
73.4
-37.1
ILE-329
GLN-330
11.1
10.6
-5.9
16.8
63.0
73.4
-37.1
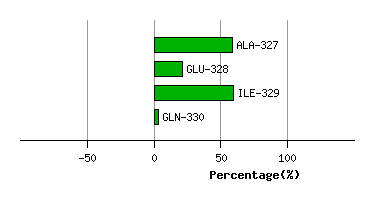
Graph shows rotational transition at bending residues and can be used
to identify hinge bending residues.
Probably only informative for interdomain rotations greater than 20 degrees
Residue
iResidue
i+1Distance of hinge axis to residue i in
(A) Distance of hinge axis to residue i in
(A) Change in
(deg) Change in
(deg) Angle of psi(i) axis to hinge axis
(deg) Angle of psi(i) axis to hinge axis
(deg) Percentage Progress
ILE-329
GLN-330
11.1
10.6
-5.9
16.8
63.0
73.4
-37.1
ILE-329
GLN-330
11.1
10.6
-5.9
16.8
63.0
73.4
-37.1
GLN-330
LYS-331
14.8
14.4
-5.7
0.6
88.3
74.1
35.1
LYS-331
GLN-332
17.4
16.9
7.8
-5.9
61.8
57.4
-2.7
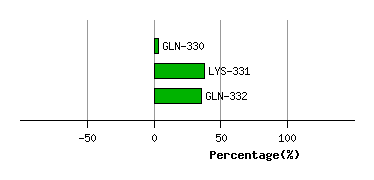
Graph shows rotational transition at bending residues and can be used
to identify hinge bending residues.
Probably only informative for interdomain rotations greater than 20 degrees
Residue
iResidue
i+1Distance of hinge axis to residue i in
(A) Distance of hinge axis to residue i in
(A) Change in
(deg) Change in
(deg) Angle of psi(i) axis to hinge axis
(deg) Angle of psi(i) axis to hinge axis
(deg) Percentage Progress
THR-351
GLY-352
10.3
10.0
-8.9
5.9
97.4
86.5
-21.1
GLY-352
LYS-353
12.1
11.9
23.1
-28.8
37.8
40.4
-16.6
LYS-353
TYR-354
14.9
14.6
-34.8
35.6
124.8
106.6
6.4
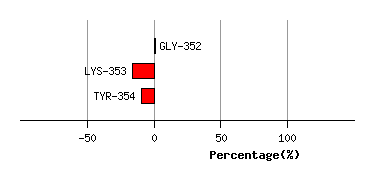
Graph shows rotational transition at bending residues and can be used
to identify hinge bending residues.
Probably only informative for interdomain rotations greater than 20 degrees
Residue
iResidue
i+1Distance of hinge axis to residue i in
(A) Distance of hinge axis to residue i in
(A) Change in
(deg) Change in
(deg) Angle of psi(i) axis to hinge axis
(deg) Angle of psi(i) axis to hinge axis
(deg) Percentage Progress
VAL-365
LYS-366
13.2
13.6
-10.2
26.0
121.4
132.3
97.5
LYS-366
GLN-367
14.3
15.0
-13.3
13.3
172.1
163.5
11.3
GLN-367
LEU-368
15.2
15.6
-12.7
6.4
115.4
105.4
-17.5
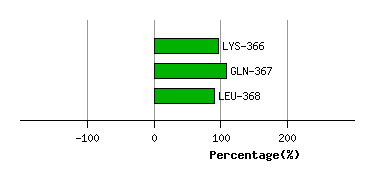
Graph shows rotational transition at bending residues and can be used
to identify hinge bending residues.
Probably only informative for interdomain rotations greater than 20 degrees
Residue
iResidue
i+1Distance of hinge axis to residue i in
(A) Distance of hinge axis to residue i in
(A) Change in
(deg) Change in
(deg) Angle of psi(i) axis to hinge axis
(deg) Angle of psi(i) axis to hinge axis
(deg) Percentage Progress
GLU-370
ALA-371
12.6
12.9
3.4
6.2
149.3
139.5
-54.3
ALA-371
VAL-372
11.2
11.4
-5.0
-3.2
82.8
80.0
5.4
VAL-372
GLN-373
7.6
7.8
-12.3
13.0
69.2
66.7
3.3
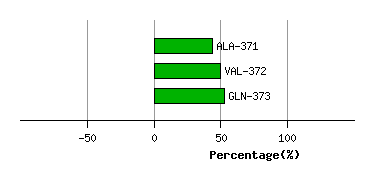
Graph shows rotational transition at bending residues and can be used
to identify hinge bending residues.
Probably only informative for interdomain rotations greater than 20 degrees
Residue
iResidue
i+1Distance of hinge axis to residue i in
(A) Distance of hinge axis to residue i in
(A) Change in
(deg) Change in
(deg) Angle of psi(i) axis to hinge axis
(deg) Angle of psi(i) axis to hinge axis
(deg) Percentage Progress
THR-377
GLU-378
8.9
8.9
-5.9
1.9
158.7
154.8
-30.8
GLU-378
SER-379
7.5
7.6
25.6
-32.2
76.0
73.1
37.4
SER-379
ILE-380
4.1
4.2
-5.5
18.4
101.9
101.1
80.0
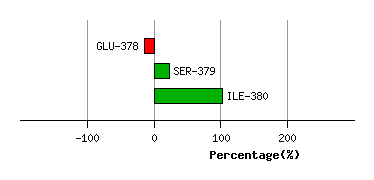
Graph shows rotational transition at bending residues and can be used
to identify hinge bending residues.
Probably only informative for interdomain rotations greater than 20 degrees
Residue
iResidue
i+1Distance of hinge axis to residue i in
(A) Distance of hinge axis to residue i in
(A) Change in
(deg) Change in
(deg) Angle of psi(i) axis to hinge axis
(deg) Angle of psi(i) axis to hinge axis
(deg) Percentage Progress
LYS-388
PHE-389
3.8
2.6
12.4
-9.3
84.2
84.4
28.6
PHE-389
LYS-390
4.3
3.8
21.5
-22.7
55.8
56.9
40.3
LYS-390
LEU-391
7.9
7.4
-18.7
11.7
104.8
101.1
28.0
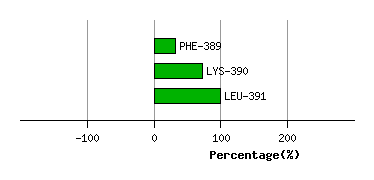
Graph shows rotational transition at bending residues and can be used
to identify hinge bending residues.
Probably only informative for interdomain rotations greater than 20 degrees