Peptide Chain Release Factor 1
(All numbering and residues are taken from first PDB file)
![]()
![]()
Bending Residue Dihedral Analysis
Residue
iResidue
i+1Distance of hinge axis to residue i in
(A) Distance of hinge axis to residue i in
(A) Change in
(deg) Change in
(deg) Angle of psi(i) axis to hinge axis
(deg) Angle of psi(i) axis to hinge axis
(deg) Percentage Progress
SER-885
ASP-886
15.6
15.7
-8.4
10.0
79.1
80.1
37.5
ASP-886
LYS-887
15.9
16.2
1.1
-2.2
39.0
37.3
14.5
LYS-887
ALA-888
17.4
17.6
-0.8
2.1
148.6
145.8
-23.7
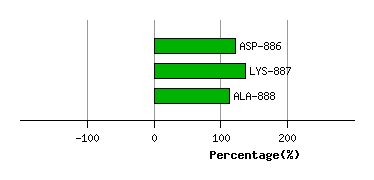
Graph shows rotational transition at bending residues and can be used
to identify hinge bending residues.
Probably only informative for interdomain rotations greater than 20 degrees
Residue
iResidue
i+1Distance of hinge axis to residue i in
(A) Distance of hinge axis to residue i in
(A) Change in
(deg) Change in
(deg) Angle of psi(i) axis to hinge axis
(deg) Angle of psi(i) axis to hinge axis
(deg) Percentage Progress
LYS-919
GLY-920
11.8
11.9
-8.1
-0.4
111.0
109.5
-82.4
GLY-920
TRP-921
15.4
15.6
-3.0
8.6
62.6
70.5
-28.8
TRP-921
ASN-922
15.8
15.8
12.5
-2.2
120.8
120.7
-88.6
ASN-922
LEU-923
18.9
18.9
-2.0
4.5
16.4
17.5
-66.5
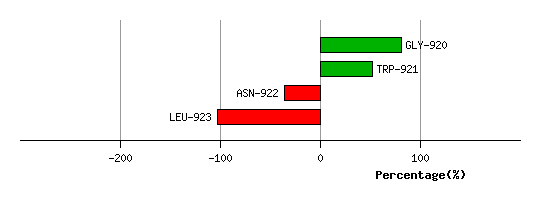
Graph shows rotational transition at bending residues and can be used
to identify hinge bending residues.
Probably only informative for interdomain rotations greater than 20 degrees
Residue
iResidue
i+1Distance of hinge axis to residue i in
(A) Distance of hinge axis to residue i in
(A) Change in
(deg) Change in
(deg) Angle of psi(i) axis to hinge axis
(deg) Angle of psi(i) axis to hinge axis
(deg) Percentage Progress
PHE-941
PHE-942
17.4
17.4
-17.6
20.2
141.6
143.7
65.4
PHE-942
VAL-943
18.1
18.2
23.1
-22.4
36.0
40.4
76.2
VAL-943
LYS-944
16.0
16.4
-6.4
10.6
138.3
141.5
39.0
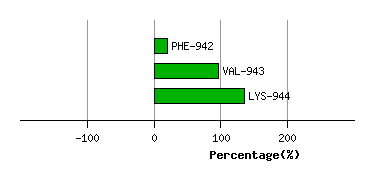
Graph shows rotational transition at bending residues and can be used
to identify hinge bending residues.
Probably only informative for interdomain rotations greater than 20 degrees
Residue
iResidue
i+1Distance of hinge axis to residue i in
(A) Distance of hinge axis to residue i in
(A) Change in
(deg) Change in
(deg) Angle of psi(i) axis to hinge axis
(deg) Angle of psi(i) axis to hinge axis
(deg) Percentage Progress
LYS-946
ASN-947
13.3
13.5
6.1
-22.2
60.0
59.1
-85.2
ASN-947
ALA-948
11.7
12.3
2.2
-7.9
29.5
36.8
-84.3
ALA-948
TYR-949
11.8
11.8
35.7
-19.7
45.4
35.5
326.1
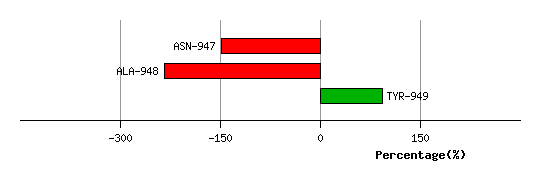
Graph shows rotational transition at bending residues and can be used
to identify hinge bending residues.
Probably only informative for interdomain rotations greater than 20 degrees
Residue
iResidue
i+1Distance of hinge axis to residue i in
(A) Distance of hinge axis to residue i in
(A) Change in
(deg) Change in
(deg) Angle of psi(i) axis to hinge axis
(deg) Angle of psi(i) axis to hinge axis
(deg) Percentage Progress
PRO-1089
GLN-1090
18.1
17.8
-1.4
-5.7
146.7
147.3
-119.6
GLN-1090
ASN-1091
17.3
17.2
2.3
4.2
37.3
35.3
106.1
ASN-1091
ARG-1092
15.6
15.6
-24.4
22.4
120.5
119.9
102.9
ARG-1092
VAL-1093
12.8
12.9
2.0
-3.7
104.0
109.3
-28.4
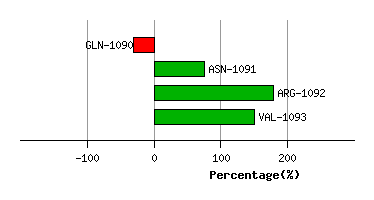
Graph shows rotational transition at bending residues and can be used
to identify hinge bending residues.
Probably only informative for interdomain rotations greater than 20 degrees
Residue
iResidue
i+1Distance of hinge axis to residue i in
(A) Distance of hinge axis to residue i in
(A) Change in
(deg) Change in
(deg) Angle of psi(i) axis to hinge axis
(deg) Angle of psi(i) axis to hinge axis
(deg) Percentage Progress
TYR-1100
THR-1101
9.8
9.4
2.0
-4.4
117.4
119.0
7.6
THR-1101
SER-1102
11.0
10.6
2.4
0.7
46.7
49.6
41.2
SER-1102
TYR-1103
11.2
11.1
-1.4
0.7
60.1
58.7
-18.9
TYR-1103
ARG-1104
14.2
14.2
11.4
-9.3
72.4
72.5
-29.9
ARG-1104
LEU-1105
13.3
13.4
-10.6
14.1
49.2
47.6
-83.6
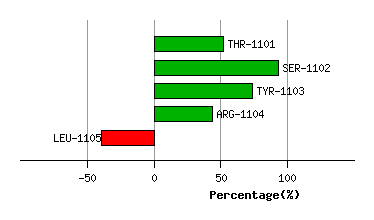
Graph shows rotational transition at bending residues and can be used
to identify hinge bending residues.
Probably only informative for interdomain rotations greater than 20 degrees
Residue
iResidue
i+1Distance of hinge axis to residue i in
(A) Distance of hinge axis to residue i in
(A) Change in
(deg) Change in
(deg) Angle of psi(i) axis to hinge axis
(deg) Angle of psi(i) axis to hinge axis
(deg) Percentage Progress
LEU-1113
ASP-1114
6.2
6.5
-4.4
5.0
131.7
129.7
46.7
ASP-1114
GLU-1115
4.3
4.5
5.1
1.1
89.3
89.2
5.8
GLU-1115
ILE-1116
5.2
5.1
-6.3
7.5
50.9
53.6
9.2
ILE-1116
ILE-1117
3.6
3.3
-3.2
0.6
99.5
100.3
-22.4
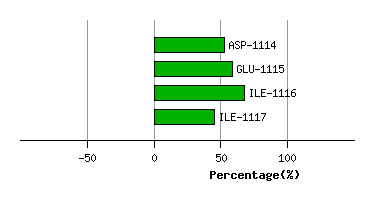
Graph shows rotational transition at bending residues and can be used
to identify hinge bending residues.
Probably only informative for interdomain rotations greater than 20 degrees
Residue
iResidue
i+1Distance of hinge axis to residue i in
(A) Distance of hinge axis to residue i in
(A) Change in
(deg) Change in
(deg) Angle of psi(i) axis to hinge axis
(deg) Angle of psi(i) axis to hinge axis
(deg) Percentage Progress
GLU-1122
HIS-1123
7.4
7.1
-4.5
-4.7
60.4
61.4
158.6
HIS-1123
ASP-1124
9.9
9.7
-15.3
25.0
87.5
85.6
10.6
ASP-1124
ILE-1125
10.6
10.2
-8.8
-0.2
150.5
143.0
-159.2
ILE-1125
GLU-1126
11.2
11.2
-15.0
25.9
104.7
103.7
3.4
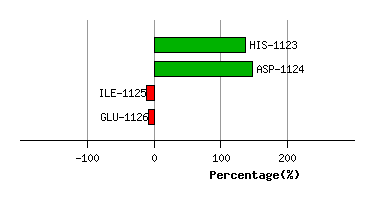
Graph shows rotational transition at bending residues and can be used
to identify hinge bending residues.
Probably only informative for interdomain rotations greater than 20 degrees