Sorcin
(All numbering and residues are taken from first PDB file)
![]()
![]()
Bending Residue Dihedral Analysis
Residue
iResidue
i+1Distance of hinge axis to residue i in
(A) Distance of hinge axis to residue i in
(A) Change in
(deg) Change in
(deg) Angle of psi(i) axis to hinge axis
(deg) Angle of psi(i) axis to hinge axis
(deg) Percentage Progress
PHE-112
ASP-113
12.1
12.6
8.9
-50.0
61.9
59.0
-109.3
ASP-113
THR-114
12.3
13.3
-6.1
-10.9
56.8
44.2
68.0
THR-114
ASP-115
15.7
15.5
23.6
-13.7
92.5
81.9
-10.6
ASP-115
ARG-116
17.5
17.7
-17.2
15.9
82.4
114.7
-7.6
ARG-116
SER-117
14.8
15.0
6.7
12.3
40.5
22.7
48.2
SER-117
GLY-118
15.2
16.1
-20.4
33.6
105.1
116.7
22.7
GLY-118
THR-119
11.8
12.6
-10.5
16.9
149.5
124.8
33.1
THR-119
VAL-120
11.2
11.6
18.5
-16.4
97.7
125.4
8.1
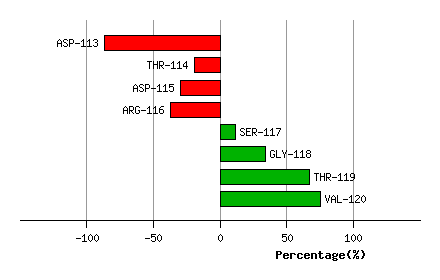
Graph shows rotational transition at bending residues and can be used
to identify hinge bending residues.
Probably only informative for interdomain rotations greater than 20 degrees
Residue
iResidue
i+1Distance of hinge axis to residue i in
(A) Distance of hinge axis to residue i in
(A) Change in
(deg) Change in
(deg) Angle of psi(i) axis to hinge axis
(deg) Angle of psi(i) axis to hinge axis
(deg) Percentage Progress
GLN-123
GLU-124
15.5
13.5
13.7
9.2
31.2
35.1
97.9
GLU-124
LEU-125
13.3
11.1
-15.5
7.9
86.2
73.6
14.1
LEU-125
GLN-126
10.2
8.3
1.8
2.4
84.2
97.3
7.5
GLN-126
LYS-127
12.5
11.2
-10.6
7.1
163.8
150.8
-13.6
LYS-127
ALA-128
13.2
11.9
4.4
-3.7
64.0
72.9
-21.7
ALA-128
LEU-129
9.6
8.4
8.0
-11.2
106.3
116.9
3.8
LEU-129
THR-130
9.8
9.3
-5.3
8.7
112.5
105.1
18.9
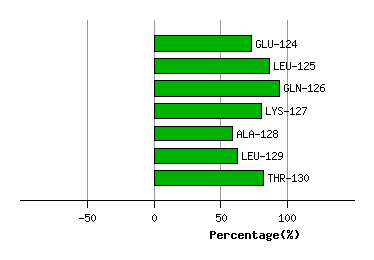
Graph shows rotational transition at bending residues and can be used
to identify hinge bending residues.
Probably only informative for interdomain rotations greater than 20 degrees
Residue
iResidue
i+1Distance of hinge axis to residue i in
(A) Distance of hinge axis to residue i in
(A) Change in
(deg) Change in
(deg) Angle of psi(i) axis to hinge axis
(deg) Angle of psi(i) axis to hinge axis
(deg) Percentage Progress
MET-132
GLY-133
10.2
11.5
-3.4
-45.7
104.0
90.0
-21.8
GLY-133
PHE-134
13.7
15.3
31.9
-2.5
18.1
41.0
106.6
PHE-134
ARG-135
13.5
15.8
-10.7
52.1
101.4
113.4
35.2
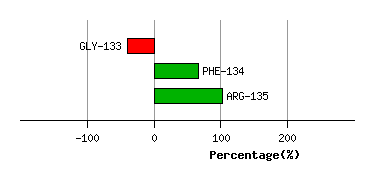
Graph shows rotational transition at bending residues and can be used
to identify hinge bending residues.
Probably only informative for interdomain rotations greater than 20 degrees
Residue
iResidue
i+1Distance of hinge axis to residue i in
(A) Distance of hinge axis to residue i in
(A) Change in
(deg) Change in
(deg) Angle of psi(i) axis to hinge axis
(deg) Angle of psi(i) axis to hinge axis
(deg) Percentage Progress
THR-150
ASN-151
10.3
10.1
161.4
-155.1
116.5
87.7
-23.8
ASN-151
GLY-152
13.4
13.6
11.7
-36.3
72.4
48.6
-59.9
GLY-152
LYS-153
13.9
13.8
5.7
19.0
25.4
17.2
124.3
LYS-153
ILE-154
12.2
12.2
-4.4
4.2
93.2
93.7
-5.5
ILE-154
THR-155
8.6
8.7
-17.7
6.0
141.4
124.1
-35.5
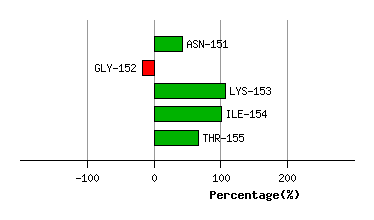
Graph shows rotational transition at bending residues and can be used
to identify hinge bending residues.
Probably only informative for interdomain rotations greater than 20 degrees
Residue
iResidue
i+1Distance of hinge axis to residue i in
(A) Distance of hinge axis to residue i in
(A) Change in
(deg) Change in
(deg) Angle of psi(i) axis to hinge axis
(deg) Angle of psi(i) axis to hinge axis
(deg) Percentage Progress
ASP-158
TYR-159
3.8
3.6
-2.2
1.4
63.9
54.1
-14.1
TYR-159
ILE-160
2.8
3.3
-12.3
3.0
69.5
67.1
22.4
ILE-160
ALA-161
1.3
1.1
-0.4
0.0
137.6
135.8
-2.4
ALA-161
CYS-162
2.7
2.3
4.8
-7.6
74.6
72.4
25.8
CYS-162
CYS-163
2.1
2.3
-3.8
-0.3
49.3
50.3
-1.9
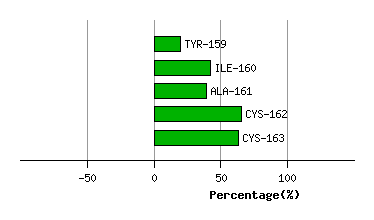
Graph shows rotational transition at bending residues and can be used
to identify hinge bending residues.
Probably only informative for interdomain rotations greater than 20 degrees