Maltose Abc Transporter, Periplasmic Maltose- Binding Protein
(All numbering and residues are taken from first PDB file)
![]()
![]()
Bending Residue Dihedral Analysis
Residue
iResidue
i+1Distance of hinge axis to residue i in
(A) Distance of hinge axis to residue i in
(A) Change in
(deg) Change in
(deg) Angle of psi(i) axis to hinge axis
(deg) Angle of psi(i) axis to hinge axis
(deg) Percentage Progress
TYR-108
ALA-109
8.5
9.1
-8.2
-8.7
62.9
59.3
10.1
ALA-109
MET-110
4.8
5.4
10.0
13.8
52.8
50.1
36.3
MET-110
GLU-111
1.3
1.9
12.6
-20.1
109.8
121.4
13.2
GLU-111
ALA-112
2.5
2.8
40.2
-9.5
69.2
64.7
35.2
ALA-112
ILE-113
5.6
5.8
-9.9
7.8
50.2
56.7
3.3
ILE-113
ALA-114
9.1
9.3
1.9
-5.1
124.3
126.0
-9.4
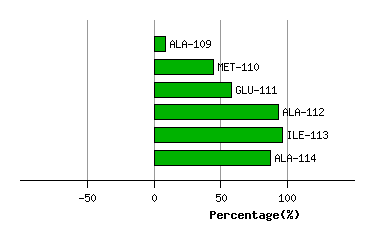
Graph shows rotational transition at bending residues and can be used
to identify hinge bending residues.
Probably only informative for interdomain rotations greater than 20 degrees
Residue
iResidue
i+1Distance of hinge axis to residue i in
(A) Distance of hinge axis to residue i in
(A) Change in
(deg) Change in
(deg) Angle of psi(i) axis to hinge axis
(deg) Angle of psi(i) axis to hinge axis
(deg) Percentage Progress
PHE-262
VAL-263
7.6
7.5
-5.7
26.5
132.4
133.6
27.7
VAL-263
GLY-264
4.1
4.2
0.8
-11.7
122.0
122.1
14.2
GLY-264
VAL-265
1.6
2.3
11.1
14.3
57.8
63.1
45.1
VAL-265
GLN-266
2.4
3.0
-7.5
10.0
75.6
78.2
5.8
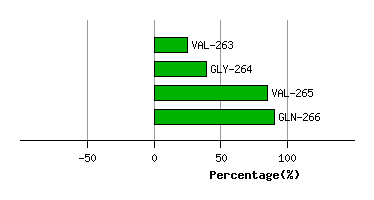
Graph shows rotational transition at bending residues and can be used
to identify hinge bending residues.
Probably only informative for interdomain rotations greater than 20 degrees
Residue
iResidue
i+1Distance of hinge axis to residue i in
(A) Distance of hinge axis to residue i in
(A) Change in
(deg) Change in
(deg) Angle of psi(i) axis to hinge axis
(deg) Angle of psi(i) axis to hinge axis
(deg) Percentage Progress
ASP-309
VAL-310
12.6
12.8
9.3
-10.1
114.1
113.2
0.3
VAL-310
LEU-311
9.8
10.3
-2.6
0.8
66.9
78.8
-0.7
LEU-311
GLU-312
7.3
7.2
7.9
-5.7
154.8
151.5
-3.5
GLU-312
LEU-313
9.8
9.2
3.7
7.8
133.9
142.8
-18.7
LEU-313
VAL-314
9.2
8.5
-7.1
1.0
75.5
78.3
9.7
VAL-314
LYS-315
5.5
4.8
-5.1
9.8
77.6
91.6
2.8
LYS-315
ASP-316
5.0
4.5
-25.3
-30.5
30.7
47.8
78.8
ASP-316
ASN-317
3.2
3.3
24.9
15.3
76.3
98.0
5.1
ASN-317
PRO-318
1.2
0.5
11.9
17.0
63.3
71.9
20.3
PRO-318
ASP-319
4.9
4.0
-1.7
-13.3
155.8
155.9
-25.2
ASP-319
VAL-320
5.0
4.7
0.2
10.5
44.4
44.6
18.0
VAL-320
VAL-321
2.2
1.6
-11.3
7.6
104.8
93.1
-0.5
VAL-321
GLY-322
5.5
4.6
0.3
1.2
53.6
57.5
2.8
GLY-322
PHE-323
7.7
7.0
2.3
-10.3
18.1
7.5
-14.3
PHE-323
THR-324
5.7
5.4
10.0
10.5
60.8
65.4
32.0
THR-324
LEU-325
4.9
5.2
-9.4
2.1
106.2
99.0
-11.9
LEU-325
SER-326
8.7
8.9
-2.5
-0.8
142.6
143.8
-6.6
SER-326
ALA-327
8.9
9.2
4.4
-5.0
35.3
34.5
1.6
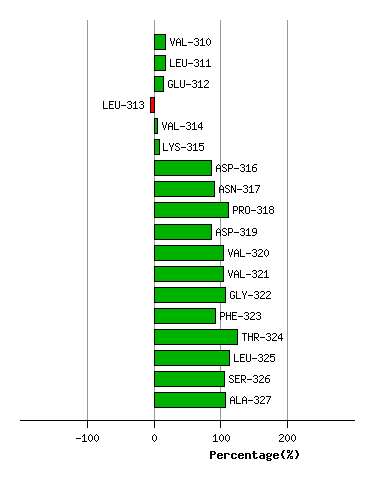
Graph shows rotational transition at bending residues and can be used
to identify hinge bending residues.
Probably only informative for interdomain rotations greater than 20 degrees