4-Diphosphocytidyl-2-C-Methylerythritol Synthetase
(All numbering and residues are taken from first PDB file)
![]()
![]()
Bending Residue Dihedral Analysis
Residue
iResidue
i+1Distance of hinge axis to residue i in
(A) Distance of hinge axis to residue i in
(A) Change in
(deg) Change in
(deg) Angle of psi(i) axis to hinge axis
(deg) Angle of psi(i) axis to hinge axis
(deg) Percentage Progress
PRO-13
ALA-14
10.0
10.3
-1.5
6.2
135.3
135.8
109.9
ALA-14
ALA-15
10.6
10.9
-3.3
-2.8
117.7
119.3
5.6
PRO-26
LYS-27
14.9
14.5
-157.6
9.7
79.1
65.9
510.1
LYS-27
GLN-28
13.6
13.4
-7.7
-6.2
94.5
100.1
-16.8
GLN-28
TYR-29
10.0
9.7
10.1
-3.3
20.4
13.6
27.9
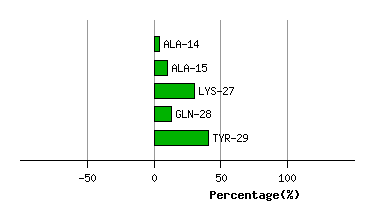
Graph shows rotational transition at bending residues and can be used
to identify hinge bending residues.
Probably only informative for interdomain rotations greater than 20 degrees
Residue
iResidue
i+1Distance of hinge axis to residue i in
(A) Distance of hinge axis to residue i in
(A) Change in
(deg) Change in
(deg) Angle of psi(i) axis to hinge axis
(deg) Angle of psi(i) axis to hinge axis
(deg) Percentage Progress
LEU-46
ALA-47
6.6
6.7
3.6
-0.6
86.1
87.3
-14.4
ALA-47
HIS-48
8.6
8.9
-2.6
3.6
141.8
141.7
40.4
HIS-48
PRO-49
9.7
10.0
5.2
-11.6
98.2
99.2
-48.1
PRO-49
ARG-50
12.7
12.9
9.4
-6.8
61.8
58.1
11.1
ARG-50
VAL-51
11.9
12.1
6.2
-10.2
113.1
114.6
162.1
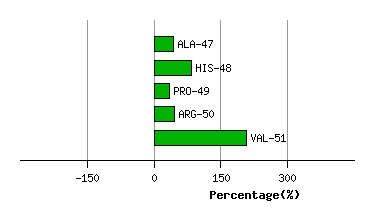
Graph shows rotational transition at bending residues and can be used
to identify hinge bending residues.
Probably only informative for interdomain rotations greater than 20 degrees
Residue
iResidue
i+1Distance of hinge axis to residue i in
(A) Distance of hinge axis to residue i in
(A) Change in
(deg) Change in
(deg) Angle of psi(i) axis to hinge axis
(deg) Angle of psi(i) axis to hinge axis
(deg) Percentage Progress
ARG-64
PHE-65
11.1
11.5
-26.9
3.3
66.4
73.1
83.4
PHE-65
ALA-66
9.4
9.6
7.0
0.8
49.9
46.9
59.4
ALA-66
GLN-67
10.3
10.2
-14.9
18.2
137.5
133.1
50.7
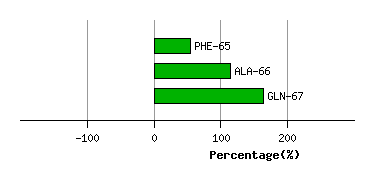
Graph shows rotational transition at bending residues and can be used
to identify hinge bending residues.
Probably only informative for interdomain rotations greater than 20 degrees
Residue
iResidue
i+1Distance of hinge axis to residue i in
(A) Distance of hinge axis to residue i in
(A) Change in
(deg) Change in
(deg) Angle of psi(i) axis to hinge axis
(deg) Angle of psi(i) axis to hinge axis
(deg) Percentage Progress
LEU-68
PRO-69
4.8
4.8
0.5
-14.7
89.1
91.5
-49.5
PRO-69
LEU-70
3.9
4.0
18.1
5.3
35.0
28.5
245.9
LEU-70
ALA-71
5.2
5.1
-12.5
1.2
85.3
88.8
-14.5
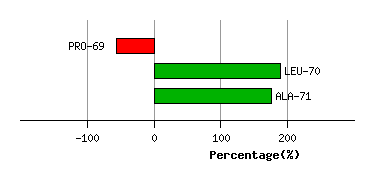
Graph shows rotational transition at bending residues and can be used
to identify hinge bending residues.
Probably only informative for interdomain rotations greater than 20 degrees
Residue
iResidue
i+1Distance of hinge axis to residue i in
(A) Distance of hinge axis to residue i in
(A) Change in
(deg) Change in
(deg) Angle of psi(i) axis to hinge axis
(deg) Angle of psi(i) axis to hinge axis
(deg) Percentage Progress
VAL-102
LEU-103
8.7
8.8
-5.7
10.1
87.1
87.5
-12.7
LEU-103
VAL-104
5.2
5.1
-6.7
7.9
120.1
119.0
6.8
VAL-104
HIS-105
5.4
5.3
4.3
-4.3
77.2
76.8
22.1
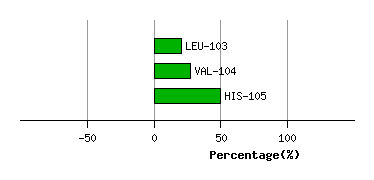
Graph shows rotational transition at bending residues and can be used
to identify hinge bending residues.
Probably only informative for interdomain rotations greater than 20 degrees
Residue
iResidue
i+1Distance of hinge axis to residue i in
(A) Distance of hinge axis to residue i in
(A) Change in
(deg) Change in
(deg) Angle of psi(i) axis to hinge axis
(deg) Angle of psi(i) axis to hinge axis
(deg) Percentage Progress
LEU-120
LEU-121
5.1
5.3
-2.3
1.4
90.7
90.1
0.7
LEU-121
ALA-122
7.1
7.4
-1.0
2.0
139.2
139.9
23.5
ALA-122
LEU-123
9.4
9.6
4.9
-4.8
39.3
38.5
16.9
LEU-123
SER-124
6.9
7.2
0.6
1.2
97.8
96.6
47.4
LEU-123
SER-124
6.9
7.2
0.6
1.2
97.8
96.6
47.4
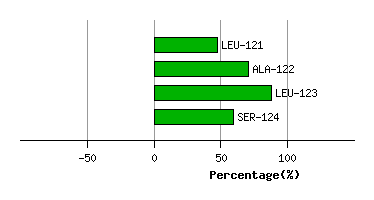
Graph shows rotational transition at bending residues and can be used
to identify hinge bending residues.
Probably only informative for interdomain rotations greater than 20 degrees
Residue
iResidue
i+1Distance of hinge axis to residue i in
(A) Distance of hinge axis to residue i in
(A) Change in
(deg) Change in
(deg) Angle of psi(i) axis to hinge axis
(deg) Angle of psi(i) axis to hinge axis
(deg) Percentage Progress
LEU-123
SER-124
6.9
7.2
0.6
1.2
97.8
96.6
47.4
LEU-123
SER-124
6.9
7.2
0.6
1.2
97.8
96.6
47.4
SER-124
GLU-125
9.4
9.8
-4.0
26.2
54.1
51.8
-222.9
GLU-125
THR-126
11.9
12.2
-33.1
14.6
26.6
14.7
175.1
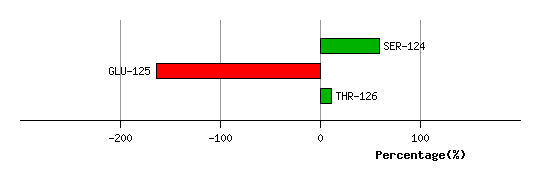
Graph shows rotational transition at bending residues and can be used
to identify hinge bending residues.
Probably only informative for interdomain rotations greater than 20 degrees
Residue
iResidue
i+1Distance of hinge axis to residue i in
(A) Distance of hinge axis to residue i in
(A) Change in
(deg) Change in
(deg) Angle of psi(i) axis to hinge axis
(deg) Angle of psi(i) axis to hinge axis
(deg) Percentage Progress
THR-165
PRO-166
4.6
4.5
0.5
-4.1
118.3
113.1
20.1
PRO-166
GLN-167
1.8
1.6
0.9
3.2
11.0
14.6
13.5
GLN-167
PHE-168
2.8
2.8
0.5
-5.2
92.1
91.0
25.5
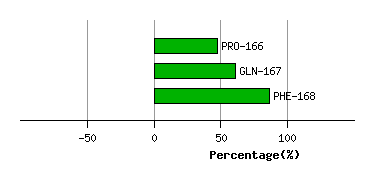
Graph shows rotational transition at bending residues and can be used
to identify hinge bending residues.
Probably only informative for interdomain rotations greater than 20 degrees
Residue
iResidue
i+1Distance of hinge axis to residue i in
(A) Distance of hinge axis to residue i in
(A) Change in
(deg) Change in
(deg) Angle of psi(i) axis to hinge axis
(deg) Angle of psi(i) axis to hinge axis
(deg) Percentage Progress
THR-189
ASP-190
14.5
14.5
-69.2
52.8
105.0
112.3
-64.1
ASP-190
GLU-191
10.9
10.8
0.2
10.3
116.5
119.0
-45.3
GLU-191
ALA-192
9.3
9.4
-8.9
7.8
12.0
12.7
-20.3
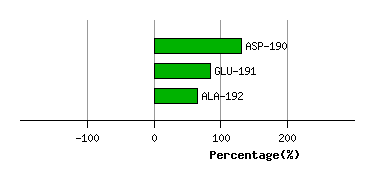
Graph shows rotational transition at bending residues and can be used
to identify hinge bending residues.
Probably only informative for interdomain rotations greater than 20 degrees