DNA Topoisomerase I
(All numbering and residues are taken from first PDB file)
![]()
![]()
Bending Residue Dihedral Analysis
Residue
iResidue
i+1Distance of hinge axis to residue i in
(A) Distance of hinge axis to residue i in
(A) Change in
(deg) Change in
(deg) Angle of psi(i) axis to hinge axis
(deg) Angle of psi(i) axis to hinge axis
(deg) Percentage Progress
THR-277
SER-278
12.9
12.6
-5.1
1.1
8.3
10.7
31.6
SER-278
LYS-279
11.2
10.9
21.7
-16.6
96.3
92.8
14.1
LYS-279
PRO-280
9.6
9.2
-0.1
0.7
40.0
35.7
8.3
PRO-280
GLY-281
6.7
6.3
2.2
2.3
144.9
140.8
-46.8
GLY-281
ALA-282
7.4
7.1
-0.4
3.0
81.0
81.8
-2.1
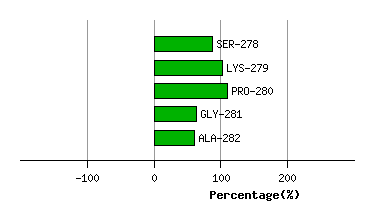
Graph shows rotational transition at bending residues and can be used
to identify hinge bending residues.
Probably only informative for interdomain rotations greater than 20 degrees
Residue
iResidue
i+1Distance of hinge axis to residue i in
(A) Distance of hinge axis to residue i in
(A) Change in
(deg) Change in
(deg) Angle of psi(i) axis to hinge axis
(deg) Angle of psi(i) axis to hinge axis
(deg) Percentage Progress
GLN-402
MET-403
6.9
6.9
3.1
-3.6
150.2
151.8
2.4
MET-403
THR-404
4.2
4.2
4.3
-7.1
109.1
109.6
9.8
THR-404
PRO-405
5.3
5.1
-0.9
3.1
114.7
110.7
1.3
PRO-405
ALA-406
7.3
7.1
-3.9
2.8
64.3
65.7
-4.0
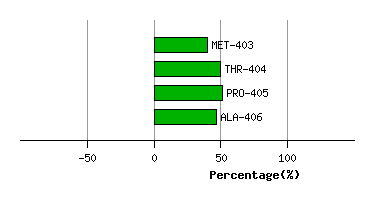
Graph shows rotational transition at bending residues and can be used
to identify hinge bending residues.
Probably only informative for interdomain rotations greater than 20 degrees