Fructose-1,6-Bisphosphatase (D-Fructose-1,6-Bisphosphate 3 1-Phosphohydrolase) (E.C.3.1.3.11)
(All numbering and residues are taken from first PDB file)
![]()
![]()
Bending Residue Dihedral Analysis
Residue
iResidue
i+1Distance of hinge axis to residue i in
(A) Distance of hinge axis to residue i in
(A) Change in
(deg) Change in
(deg) Angle of psi(i) axis to hinge axis
(deg) Angle of psi(i) axis to hinge axis
(deg) Percentage Progress
SER-150
PRO-151
4.8
4.3
20.3
14.5
147.1
156.4
-80.5
PRO-151
ASN-152
5.7
4.5
1.1
-11.2
94.0
94.2
12.8
ASN-152
ASP-153
8.9
8.3
9.8
-17.4
152.4
144.4
29.4
ASP-153
GLU-154
8.4
7.5
92.1
-80.3
113.5
92.6
27.2
GLU-154
CYS-155
4.8
4.4
-27.4
-148.1
29.1
36.3
335.0
CYS-155
ILE-156
3.2
3.3
-111.3
118.9
40.9
104.2
1.0
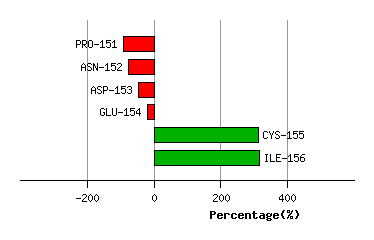
Graph shows rotational transition at bending residues and can be used
to identify hinge bending residues.
Probably only informative for interdomain rotations greater than 20 degrees
Residue
iResidue
i+1Distance of hinge axis to residue i in
(A) Distance of hinge axis to residue i in
(A) Change in
(deg) Change in
(deg) Angle of psi(i) axis to hinge axis
(deg) Angle of psi(i) axis to hinge axis
(deg) Percentage Progress
ARG-173
CYS-174
10.5
8.2
-42.0
30.0
127.5
62.1
0.3
CYS-174
VAL-175
7.1
6.2
-176.3
63.4
87.0
16.5
257.3
VAL-175
VAL-176
3.9
6.7
113.4
151.6
151.8
116.9
-573.3
VAL-176
ASN-177
4.8
5.8
-151.6
-2.2
73.7
33.6
278.6
ASN-177
VAL-178
1.8
2.9
125.7
-6.2
100.4
149.1
310.9
VAL-178
CYS-179
4.6
5.5
140.8
45.8
135.8
102.1
-346.4
VAL-178
CYS-179
4.6
5.5
140.8
45.8
135.8
102.1
-346.4
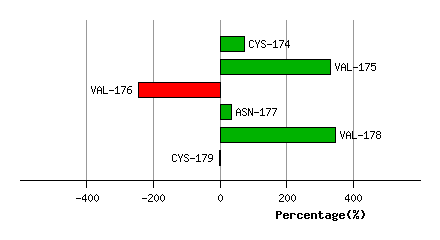
Graph shows rotational transition at bending residues and can be used
to identify hinge bending residues.
Probably only informative for interdomain rotations greater than 20 degrees
Residue
iResidue
i+1Distance of hinge axis to residue i in
(A) Distance of hinge axis to residue i in
(A) Change in
(deg) Change in
(deg) Angle of psi(i) axis to hinge axis
(deg) Angle of psi(i) axis to hinge axis
(deg) Percentage Progress
VAL-178
CYS-179
4.6
5.5
140.8
45.8
135.8
102.1
-346.4
VAL-178
CYS-179
4.6
5.5
140.8
45.8
135.8
102.1
-346.4
CYS-179
GLN-180
7.6
7.8
-20.7
-39.6
58.4
74.8
62.5
GLN-180
PRO-181
7.9
7.0
-37.9
46.5
73.6
64.6
-39.3
PRO-181
GLY-182
11.5
10.5
-99.9
92.1
13.1
11.5
25.8
GLY-182
ASP-183
12.2
12.2
16.9
4.8
126.5
100.9
-34.4
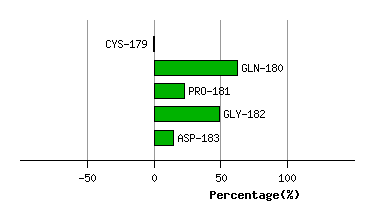
Graph shows rotational transition at bending residues and can be used
to identify hinge bending residues.
Probably only informative for interdomain rotations greater than 20 degrees