Receptor Protein-Tyrosine Kinase Erbb-2
(All numbering and residues are taken from first PDB file)
![]()
![]()
Bending Residue Dihedral Analysis
Residue
iResidue
i+1Distance of hinge axis to residue i in
(A) Distance of hinge axis to residue i in
(A) Change in
(deg) Change in
(deg) Angle of psi(i) axis to hinge axis
(deg) Angle of psi(i) axis to hinge axis
(deg) Percentage Progress
GLN-424
GLY-425
5.4
5.1
8.9
1.3
146.6
149.7
-114.3
GLN-424
GLY-425
15.2
14.8
8.9
1.3
151.4
154.0
-99.0
GLY-425
LEU-426
14.7
14.4
-8.1
5.9
74.9
74.3
8.4
GLN-424
GLY-425
5.4
5.1
8.9
1.3
146.6
149.7
-114.3
GLN-424
GLY-425
15.2
14.8
8.9
1.3
151.4
154.0
-99.0
GLY-425
LEU-426
14.7
14.4
-8.1
5.9
74.9
74.3
8.4
LEU-426
GLY-427
12.0
11.4
-28.0
-6.6
50.8
48.5
166.1
GLY-427
ILE-428
9.1
8.2
44.2
-5.2
59.2
73.4
-125.4
ILE-428
SER-429
6.7
6.2
9.8
-7.3
92.5
89.9
15.2
SER-429
TRP-430
3.2
2.7
10.7
-11.2
27.8
27.1
-9.0
TRP-430
LEU-431
2.5
2.0
-4.5
2.3
127.2
125.1
13.4
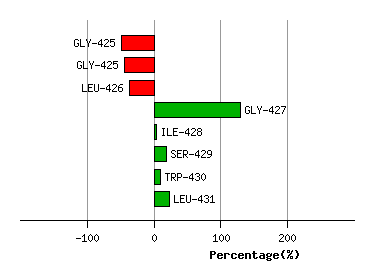
Graph shows rotational transition at bending residues and can be used
to identify hinge bending residues.
Probably only informative for interdomain rotations greater than 20 degrees
Residue
iResidue
i+1Distance of hinge axis to residue i in
(A) Distance of hinge axis to residue i in
(A) Change in
(deg) Change in
(deg) Angle of psi(i) axis to hinge axis
(deg) Angle of psi(i) axis to hinge axis
(deg) Percentage Progress
THR-450
HIS-451
10.4
10.0
15.8
6.3
81.2
88.9
-12.4
HIS-451
LEU-452
6.7
6.3
-0.7
10.8
154.2
156.9
89.6
LEU-452
CYS-453
6.4
6.1
11.9
-24.6
67.8
70.2
-93.9
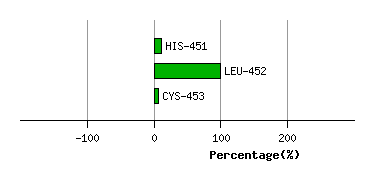
Graph shows rotational transition at bending residues and can be used
to identify hinge bending residues.
Probably only informative for interdomain rotations greater than 20 degrees
Residue
iResidue
i+1Distance of hinge axis to residue i in
(A) Distance of hinge axis to residue i in
(A) Change in
(deg) Change in
(deg) Angle of psi(i) axis to hinge axis
(deg) Angle of psi(i) axis to hinge axis
(deg) Percentage Progress
HIS-456
THR-457
9.7
9.5
-34.1
27.6
66.8
57.4
262.7
THR-457
VAL-458
7.2
7.2
11.3
7.5
147.8
143.7
-156.5
VAL-458
PRO-459
5.6
5.4
2.1
-8.8
136.2
133.6
53.2
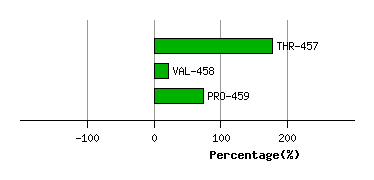
Graph shows rotational transition at bending residues and can be used
to identify hinge bending residues.
Probably only informative for interdomain rotations greater than 20 degrees
Residue
iResidue
i+1Distance of hinge axis to residue i in
(A) Distance of hinge axis to residue i in
(A) Change in
(deg) Change in
(deg) Angle of psi(i) axis to hinge axis
(deg) Angle of psi(i) axis to hinge axis
(deg) Percentage Progress
THR-474
ALA-475
5.7
5.9
0.1
12.9
36.1
34.8
21.7
THR-474
ALA-475
16.8
16.6
0.1
12.9
143.1
145.0
-24.9
ALA-475
ASN-476
15.6
15.6
-0.8
-0.2
92.7
85.9
21.6
THR-474
ALA-475
5.7
5.9
0.1
12.9
36.1
34.8
21.7
THR-474
ALA-475
16.8
16.6
0.1
12.9
143.1
145.0
-24.9
ALA-475
ASN-476
15.6
15.6
-0.8
-0.2
92.7
85.9
21.6
ASN-476
ARG-477
11.9
11.9
13.7
-19.6
119.4
123.0
35.7
ARG-477
PRO-478
10.1
10.1
1.2
0.9
64.8
56.4
3.7
PRO-478
GLU-479
12.9
12.8
0.1
10.6
71.2
70.8
-22.7
GLU-479
ASP-480
12.5
11.9
-2.3
-0.7
61.7
57.7
-12.5
ASP-480
GLU-481
14.6
14.3
-6.2
9.8
42.0
33.7
-14.2
GLU-481
CYS-482
11.9
12.0
3.1
-9.5
72.6
76.2
35.5
CYS-482
VAL-483
9.3
9.2
-3.4
8.0
96.1
99.0
36.3
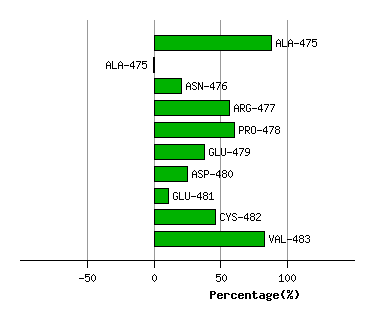
Graph shows rotational transition at bending residues and can be used
to identify hinge bending residues.
Probably only informative for interdomain rotations greater than 20 degrees