Tata-Binding Protein
(All numbering and residues are taken from first PDB file)
![]()
![]()
Bending Residue Dihedral Analysis
Residue
iResidue
i+1Distance of hinge axis to residue i in
(A) Distance of hinge axis to residue i in
(A) Change in
(deg) Change in
(deg) Angle of psi(i) axis to hinge axis
(deg) Angle of psi(i) axis to hinge axis
(deg) Percentage Progress
GLU-12
ASN-13
5.5
5.5
-1.3
-8.5
41.6
37.0
45.8
ASN-13
ILE-14
3.1
3.1
5.2
-2.3
88.0
87.0
34.5
ILE-14
VAL-15
0.8
0.9
-0.9
-3.9
50.8
47.8
35.8
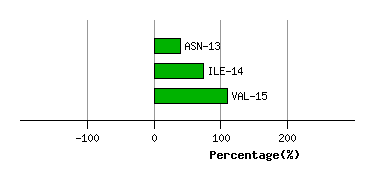
Graph shows rotational transition at bending residues and can be used
to identify hinge bending residues.
Probably only informative for interdomain rotations greater than 20 degrees
Residue
iResidue
i+1Distance of hinge axis to residue i in
(A) Distance of hinge axis to residue i in
(A) Change in
(deg) Change in
(deg) Angle of psi(i) axis to hinge axis
(deg) Angle of psi(i) axis to hinge axis
(deg) Percentage Progress
VAL-67
THR-68
4.8
4.8
-4.9
5.4
28.0
34.2
17.7
THR-68
GLY-69
4.5
5.3
-5.8
-18.4
101.6
95.9
-13.0
GLY-69
ALA-70
4.7
5.4
29.4
-25.6
86.8
80.6
41.3
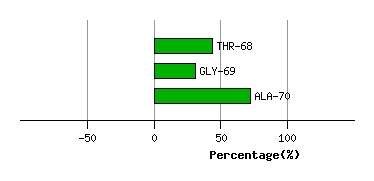
Graph shows rotational transition at bending residues and can be used
to identify hinge bending residues.
Probably only informative for interdomain rotations greater than 20 degrees
Residue
iResidue
i+1Distance of hinge axis to residue i in
(A) Distance of hinge axis to residue i in
(A) Change in
(deg) Change in
(deg) Angle of psi(i) axis to hinge axis
(deg) Angle of psi(i) axis to hinge axis
(deg) Percentage Progress
VAL-73
GLN-74
6.4
5.8
7.6
-0.3
161.5
161.9
-67.1
GLN-74
ASP-75
7.7
7.2
-14.5
6.9
61.5
57.0
58.3
ASP-75
ILE-76
4.6
4.1
-0.1
3.0
66.5
74.5
-13.2
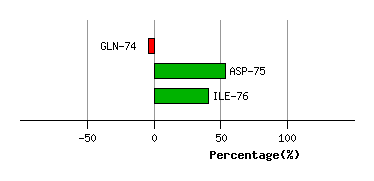
Graph shows rotational transition at bending residues and can be used
to identify hinge bending residues.
Probably only informative for interdomain rotations greater than 20 degrees
Residue
iResidue
i+1Distance of hinge axis to residue i in
(A) Distance of hinge axis to residue i in
(A) Change in
(deg) Change in
(deg) Angle of psi(i) axis to hinge axis
(deg) Angle of psi(i) axis to hinge axis
(deg) Percentage Progress
ASN-104
MET-105
5.7
5.4
4.2
3.7
85.2
83.5
33.6
MET-105
VAL-106
2.2
1.9
7.3
-11.0
133.6
137.7
1.8
VAL-106
PHE-107
2.2
2.2
1.1
-1.7
100.5
99.1
17.7
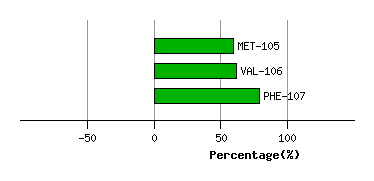
Graph shows rotational transition at bending residues and can be used
to identify hinge bending residues.
Probably only informative for interdomain rotations greater than 20 degrees