Hypoxanthine-Guanine Phosphoribosyltransferase
(All numbering and residues are taken from first PDB file)
![]()
![]()
Bending Residue Dihedral Analysis
Residue
iResidue
i+1Distance of hinge axis to residue i in
(A) Distance of hinge axis to residue i in
(A) Change in
(deg) Change in
(deg) Angle of psi(i) axis to hinge axis
(deg) Angle of psi(i) axis to hinge axis
(deg) Percentage Progress
VAL-8
ILE-9
1.9
2.1
18.5
-26.1
124.0
120.0
-11.7
ILE-9
SER-10
3.4
3.6
-39.4
25.3
35.9
39.8
93.9
SER-10
ASP-11
2.9
2.8
-13.5
17.2
78.1
78.2
-0.6
ASP-11
ASP-12
5.2
5.6
1.3
3.6
118.2
116.8
-69.1
ASP-12
GLU-13
6.6
6.8
-14.5
5.0
121.8
120.4
-92.3
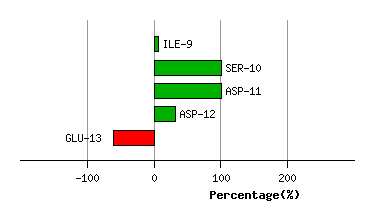
Graph shows rotational transition at bending residues and can be used
to identify hinge bending residues.
Probably only informative for interdomain rotations greater than 20 degrees
Residue
iResidue
i+1Distance of hinge axis to residue i in
(A) Distance of hinge axis to residue i in
(A) Change in
(deg) Change in
(deg) Angle of psi(i) axis to hinge axis
(deg) Angle of psi(i) axis to hinge axis
(deg) Percentage Progress
GLU-46
ARG-47
8.2
8.3
-6.5
16.7
75.2
74.3
-16.4
ARG-47
LEU-48
8.3
8.5
-19.1
17.3
104.6
109.3
85.0
LEU-48
ALA-49
5.1
5.3
-12.7
12.3
165.4
158.9
-30.6
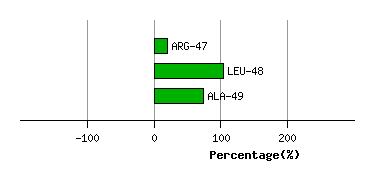
Graph shows rotational transition at bending residues and can be used
to identify hinge bending residues.
Probably only informative for interdomain rotations greater than 20 degrees
Residue
iResidue
i+1Distance of hinge axis to residue i in
(A) Distance of hinge axis to residue i in
(A) Change in
(deg) Change in
(deg) Angle of psi(i) axis to hinge axis
(deg) Angle of psi(i) axis to hinge axis
(deg) Percentage Progress
MET-56
GLY-57
10.8
10.8
-12.1
7.4
31.2
35.5
78.5
GLY-57
GLY-58
10.4
11.1
162.4
152.6
137.7
129.8
454.4
GLY-58
HIS-59
13.5
12.9
33.0
3.4
143.3
121.0
-362.7
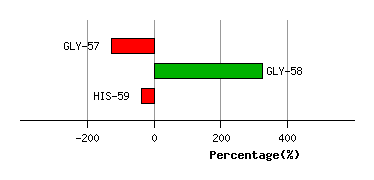
Graph shows rotational transition at bending residues and can be used
to identify hinge bending residues.
Probably only informative for interdomain rotations greater than 20 degrees
Residue
iResidue
i+1Distance of hinge axis to residue i in
(A) Distance of hinge axis to residue i in
(A) Change in
(deg) Change in
(deg) Angle of psi(i) axis to hinge axis
(deg) Angle of psi(i) axis to hinge axis
(deg) Percentage Progress
ASP-76
LEU-77
7.2
7.0
-6.4
7.5
90.1
89.8
5.0
LEU-77
LEU-78
3.6
3.6
-2.1
7.7
158.4
153.9
-21.4
LEU-78
ASP-79
2.9
2.8
4.9
-4.2
66.5
65.4
118.0
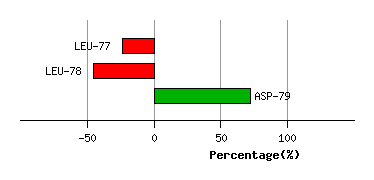
Graph shows rotational transition at bending residues and can be used
to identify hinge bending residues.
Probably only informative for interdomain rotations greater than 20 degrees
Residue
iResidue
i+1Distance of hinge axis to residue i in
(A) Distance of hinge axis to residue i in
(A) Change in
(deg) Change in
(deg) Angle of psi(i) axis to hinge axis
(deg) Angle of psi(i) axis to hinge axis
(deg) Percentage Progress
ILE-92
PRO-93
9.0
8.6
13.6
-0.5
88.4
83.8
43.9
PRO-93
MET-94
6.1
5.8
0.7
13.8
23.9
18.7
150.7
MET-94
THR-95
4.3
4.0
3.7
-8.4
101.8
104.1
-12.6
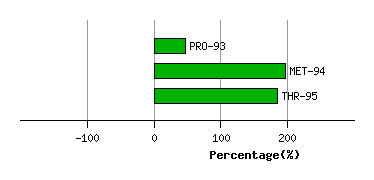
Graph shows rotational transition at bending residues and can be used
to identify hinge bending residues.
Probably only informative for interdomain rotations greater than 20 degrees
Residue
iResidue
i+1Distance of hinge axis to residue i in
(A) Distance of hinge axis to residue i in
(A) Change in
(deg) Change in
(deg) Angle of psi(i) axis to hinge axis
(deg) Angle of psi(i) axis to hinge axis
(deg) Percentage Progress
ASP-97
PHE-98
8.8
9.2
37.0
-35.6
149.6
140.7
-43.5
PHE-98
ILE-99
10.8
11.9
9.4
-17.6
90.9
99.6
65.2
ILE-99
ARG-100
13.7
14.6
-45.3
33.1
39.3
39.3
107.2
ARG-100
LEU-101
16.8
17.3
-2.1
-41.4
73.3
73.1
82.6
LEU-101
LYS-102
18.5
19.2
-164.1
70.4
82.3
47.9
575.6
ILE-113
LYS-114
22.7
25.1
-29.2
-65.9
172.6
39.6
-560.3
LYS-114
VAL-115
22.2
24.6
139.1
30.7
77.8
77.3
1635.4
VAL-115
ILE-116
18.9
25.3
-174.6
6.3
153.7
149.8
-2170.6
ILE-116
GLY-117
18.6
24.2
93.9
-163.4
55.9
85.1
197.6
GLY-117
GLY-118
15.1
20.8
-174.2
5.5
169.7
74.1
2125.0
GLY-118
ASP-119
14.3
20.7
-11.0
67.1
120.8
158.8
-3101.6
ASP-119
ASP-120
14.1
20.8
166.5
-22.3
114.7
79.7
-41.3
ASP-120
LEU-121
17.1
17.1
-134.5
-33.5
48.5
42.5
1571.9
LEU-121
SER-122
17.3
17.3
1.9
-7.3
68.6
73.0
-82.7
SER-122
THR-123
18.5
18.6
5.2
26.0
72.3
69.7
-59.5
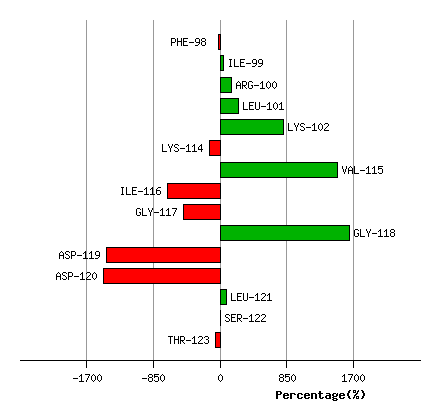
Graph shows rotational transition at bending residues and can be used
to identify hinge bending residues.
Probably only informative for interdomain rotations greater than 20 degrees
Residue
iResidue
i+1Distance of hinge axis to residue i in
(A) Distance of hinge axis to residue i in
(A) Change in
(deg) Change in
(deg) Angle of psi(i) axis to hinge axis
(deg) Angle of psi(i) axis to hinge axis
(deg) Percentage Progress
SER-161
LEU-162
4.5
4.3
14.3
-19.2
64.5
74.9
-15.3
LEU-162
LEU-163
3.6
3.4
0.4
-6.7
5.3
1.2
-55.1
LEU-163
VAL-164
4.9
4.7
6.7
-18.3
74.1
74.9
-43.5
VAL-164
LYS-165
5.9
5.9
3.8
15.2
28.3
16.6
320.2
LYS-165
ARG-166
8.1
7.9
9.5
-6.6
52.9
51.6
-139.4
ARG-166
THR-167
8.4
8.0
11.2
-25.9
68.7
68.5
-57.1
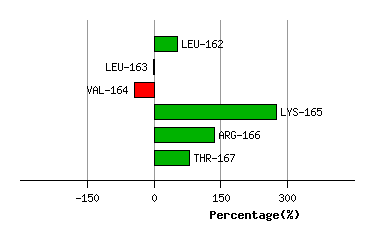
Graph shows rotational transition at bending residues and can be used
to identify hinge bending residues.
Probably only informative for interdomain rotations greater than 20 degrees
Residue
iResidue
i+1Distance of hinge axis to residue i in
(A) Distance of hinge axis to residue i in
(A) Change in
(deg) Change in
(deg) Angle of psi(i) axis to hinge axis
(deg) Angle of psi(i) axis to hinge axis
(deg) Percentage Progress
PHE-180
GLU-181
1.9
1.5
-0.7
4.4
116.8
116.8
87.7
GLU-181
ILE-182
2.2
2.4
3.3
-2.6
46.1
46.1
-76.9
ILE-182
PRO-183
4.9
4.9
14.1
-8.9
50.4
46.4
121.6
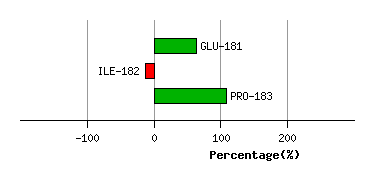
Graph shows rotational transition at bending residues and can be used
to identify hinge bending residues.
Probably only informative for interdomain rotations greater than 20 degrees