Chitinase A
(All numbering and residues are taken from first PDB file)
![]()
![]()
Bending Residue Dihedral Analysis
Residue
iResidue
i+1Distance of hinge axis to residue i in
(A) Distance of hinge axis to residue i in
(A) Change in
(deg) Change in
(deg) Angle of psi(i) axis to hinge axis
(deg) Angle of psi(i) axis to hinge axis
(deg) Percentage Progress
TRP-33
GLY-34
5.4
5.5
11.0
-19.2
137.8
153.5
115.7
GLY-34
ASN-35
4.8
4.8
-25.0
9.8
52.4
56.1
171.2
ASN-35
THR-36
2.9
2.7
7.3
0.1
116.9
118.8
-96.3
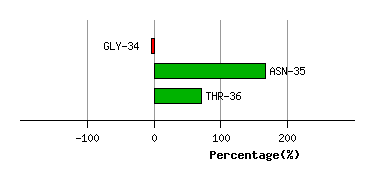
Graph shows rotational transition at bending residues and can be used
to identify hinge bending residues.
Probably only informative for interdomain rotations greater than 20 degrees
Residue
iResidue
i+1Distance of hinge axis to residue i in
(A) Distance of hinge axis to residue i in
(A) Change in
(deg) Change in
(deg) Angle of psi(i) axis to hinge axis
(deg) Angle of psi(i) axis to hinge axis
(deg) Percentage Progress
ASN-58
ALA-59
2.6
2.7
-0.2
-4.1
35.9
37.3
38.3
ALA-59
ALA-60
3.4
3.7
0.2
-10.7
142.6
142.0
84.3
ALA-60
ASP-61
2.7
2.9
2.8
-8.9
113.5
118.7
-59.1
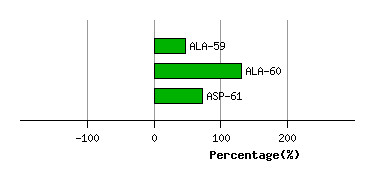
Graph shows rotational transition at bending residues and can be used
to identify hinge bending residues.
Probably only informative for interdomain rotations greater than 20 degrees
Residue
iResidue
i+1Distance of hinge axis to residue i in
(A) Distance of hinge axis to residue i in
(A) Change in
(deg) Change in
(deg) Angle of psi(i) axis to hinge axis
(deg) Angle of psi(i) axis to hinge axis
(deg) Percentage Progress
VAL-102
ASN-103
6.5
6.8
-8.2
10.0
43.6
39.8
75.8
ASN-103
LYS-104
5.7
6.1
2.3
-12.5
92.4
92.3
66.8
LYS-104
GLY-105
7.2
7.4
1.7
-5.1
32.3
32.6
-38.3
GLY-105
GLY-106
7.0
7.2
5.4
6.5
124.3
125.1
-189.7
GLY-105
GLY-106
7.0
7.2
5.4
6.5
124.3
125.1
-189.7
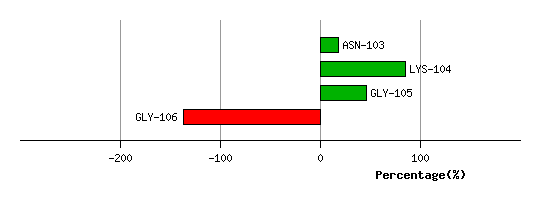
Graph shows rotational transition at bending residues and can be used
to identify hinge bending residues.
Probably only informative for interdomain rotations greater than 20 degrees
Residue
iResidue
i+1Distance of hinge axis to residue i in
(A) Distance of hinge axis to residue i in
(A) Change in
(deg) Change in
(deg) Angle of psi(i) axis to hinge axis
(deg) Angle of psi(i) axis to hinge axis
(deg) Percentage Progress
GLY-105
GLY-106
7.0
7.2
5.4
6.5
124.3
125.1
-189.7
GLY-105
GLY-106
7.0
7.2
5.4
6.5
124.3
125.1
-189.7
GLY-106
ARG-107
9.3
9.4
-20.0
10.1
23.6
17.9
170.4
ARG-107
TYR-108
9.5
9.7
-18.3
11.4
85.3
82.4
75.2
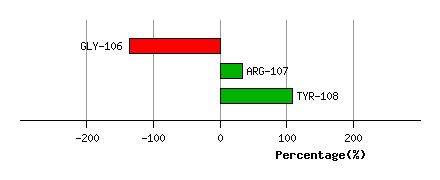
Graph shows rotational transition at bending residues and can be used
to identify hinge bending residues.
Probably only informative for interdomain rotations greater than 20 degrees
Residue
iResidue
i+1Distance of hinge axis to residue i in
(A) Distance of hinge axis to residue i in
(A) Change in
(deg) Change in
(deg) Angle of psi(i) axis to hinge axis
(deg) Angle of psi(i) axis to hinge axis
(deg) Percentage Progress
GLU-127
ILE-128
8.3
8.1
-3.9
-3.3
65.5
63.4
-58.1
ILE-128
VAL-129
5.7
5.5
-5.1
5.2
44.5
42.5
102.9
VAL-129
VAL-130
5.1
5.1
13.8
-9.8
142.7
142.7
-43.6
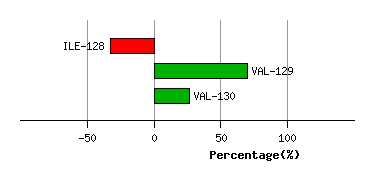
Graph shows rotational transition at bending residues and can be used
to identify hinge bending residues.
Probably only informative for interdomain rotations greater than 20 degrees