H-2 Class I Histocompatibility Antigen, K-B Alpha Chain Precursor
(All numbering and residues are taken from first PDB file)
![]()
![]()
Bending Residue Dihedral Analysis
Residue
iResidue
i+1Distance of hinge axis to residue i in
(A) Distance of hinge axis to residue i in
(A) Change in
(deg) Change in
(deg) Angle of psi(i) axis to hinge axis
(deg) Angle of psi(i) axis to hinge axis
(deg) Percentage Progress
ALA-49
ARG-50
4.8
5.0
9.1
-10.3
36.0
37.0
-2.6
ARG-50
TRP-51
7.4
7.5
-1.0
7.3
152.8
155.5
29.2
TRP-51
MET-52
6.7
6.7
-11.0
12.6
111.2
111.8
-1.1
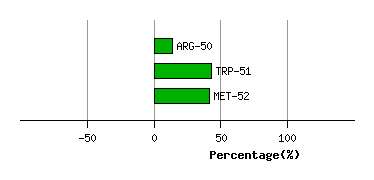
Graph shows rotational transition at bending residues and can be used
to identify hinge bending residues.
Probably only informative for interdomain rotations greater than 20 degrees
Residue
iResidue
i+1Distance of hinge axis to residue i in
(A) Distance of hinge axis to residue i in
(A) Change in
(deg) Change in
(deg) Angle of psi(i) axis to hinge axis
(deg) Angle of psi(i) axis to hinge axis
(deg) Percentage Progress
GLU-55
GLY-56
2.2
1.6
4.0
-7.9
104.7
101.8
30.4
GLY-56
PRO-57
4.7
4.8
28.9
0.9
59.1
59.3
111.6
PRO-57
GLU-58
7.8
8.1
-15.3
-4.5
74.4
88.6
-32.9
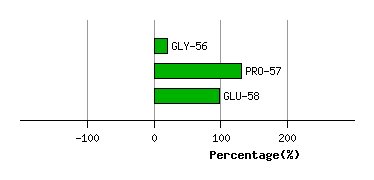
Graph shows rotational transition at bending residues and can be used
to identify hinge bending residues.
Probably only informative for interdomain rotations greater than 20 degrees
Residue
iResidue
i+1Distance of hinge axis to residue i in
(A) Distance of hinge axis to residue i in
(A) Change in
(deg) Change in
(deg) Angle of psi(i) axis to hinge axis
(deg) Angle of psi(i) axis to hinge axis
(deg) Percentage Progress
GLY-175
ASN-176
9.1
9.2
41.2
-26.5
107.1
98.9
-0.8
ASN-176
ALA-177
12.8
12.9
33.0
-23.6
118.5
116.1
-54.9
ALA-177
THR-178
14.5
14.8
45.0
-55.8
163.4
175.8
66.1
THR-178
LEU-179
12.5
13.4
-2.5
-3.4
53.3
71.8
16.7
LEU-179
LEU-180
12.6
12.9
38.0
-8.4
105.1
84.0
5.1
LEU-180
ARG-181
16.3
16.5
-65.7
43.6
84.2
58.4
60.7
ARG-181
THR-182
17.3
18.2
-43.0
60.6
23.8
41.5
-158.0
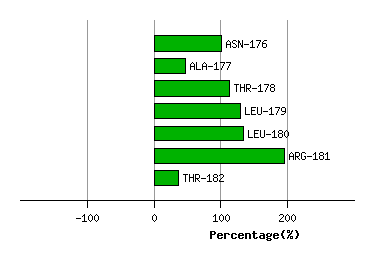
Graph shows rotational transition at bending residues and can be used
to identify hinge bending residues.
Probably only informative for interdomain rotations greater than 20 degrees