Acetyl Transferase
(All numbering and residues are taken from first PDB file)
![]()
![]()
Bending Residue Dihedral Analysis
Residue
iResidue
i+1Distance of hinge axis to residue i in
(A) Distance of hinge axis to residue i in
(A) Change in
(deg) Change in
(deg) Angle of psi(i) axis to hinge axis
(deg) Angle of psi(i) axis to hinge axis
(deg) Percentage Progress
TYR-66
ALA-67
8.4
8.0
26.1
16.9
65.4
59.1
31.5
ALA-67
LYS-68
7.1
7.4
-5.3
-1.7
159.0
157.7
-40.4
LYS-68
MET-69
6.7
6.8
-0.3
-0.9
123.6
121.1
-6.8
MET-69
TYR-70
8.2
8.2
0.7
-1.8
19.6
17.7
-5.7
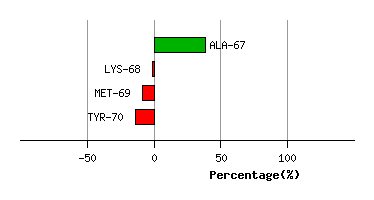
Graph shows rotational transition at bending residues and can be used
to identify hinge bending residues.
Probably only informative for interdomain rotations greater than 20 degrees
Residue
iResidue
i+1Distance of hinge axis to residue i in
(A) Distance of hinge axis to residue i in
(A) Change in
(deg) Change in
(deg) Angle of psi(i) axis to hinge axis
(deg) Angle of psi(i) axis to hinge axis
(deg) Percentage Progress
LEU-82
SER-83
6.4
6.2
4.2
-13.3
136.7
131.1
157.5
SER-83
PHE-84
6.2
5.8
6.0
4.2
139.4
144.6
-121.6
PHE-84
ASN-85
4.2
4.2
0.1
-1.4
124.0
129.2
-103.5
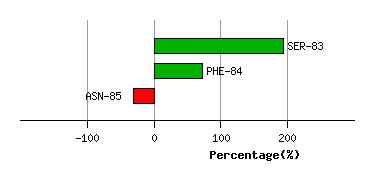
Graph shows rotational transition at bending residues and can be used
to identify hinge bending residues.
Probably only informative for interdomain rotations greater than 20 degrees
Residue
iResidue
i+1Distance of hinge axis to residue i in
(A) Distance of hinge axis to residue i in
(A) Change in
(deg) Change in
(deg) Angle of psi(i) axis to hinge axis
(deg) Angle of psi(i) axis to hinge axis
(deg) Percentage Progress
ILE-96
GLY-97
5.9
5.9
-9.6
23.4
79.7
78.7
-89.6
GLY-97
TYR-98
8.8
8.7
-6.0
-1.8
6.3
5.5
87.4
TYR-98
TRP-99
9.9
9.7
-8.0
-7.8
69.9
68.2
177.6
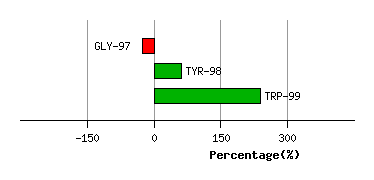
Graph shows rotational transition at bending residues and can be used
to identify hinge bending residues.
Probably only informative for interdomain rotations greater than 20 degrees
Residue
iResidue
i+1Distance of hinge axis to residue i in
(A) Distance of hinge axis to residue i in
(A) Change in
(deg) Change in
(deg) Angle of psi(i) axis to hinge axis
(deg) Angle of psi(i) axis to hinge axis
(deg) Percentage Progress
GLN-115
ALA-116
7.3
7.1
-5.5
2.2
103.8
101.4
-11.9
ALA-116
LEU-117
5.4
5.1
-2.7
-1.5
45.0
43.4
78.0
LEU-117
MET-118
2.9
2.6
2.1
2.0
143.2
147.2
-50.7
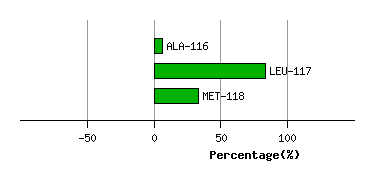
Graph shows rotational transition at bending residues and can be used
to identify hinge bending residues.
Probably only informative for interdomain rotations greater than 20 degrees
Residue
iResidue
i+1Distance of hinge axis to residue i in
(A) Distance of hinge axis to residue i in
(A) Change in
(deg) Change in
(deg) Angle of psi(i) axis to hinge axis
(deg) Angle of psi(i) axis to hinge axis
(deg) Percentage Progress
VAL-136
ASP-137
20.7
21.1
-1.0
-7.5
35.8
38.9
80.7
ASP-137
ASN-138
22.9
23.5
-1.0
-6.6
35.5
28.8
122.8
ASN-138
GLN-139
20.1
21.1
3.0
2.0
126.2
119.5
-41.7
GLN-139
ALA-140
21.1
21.6
-3.0
3.8
58.2
58.1
17.8
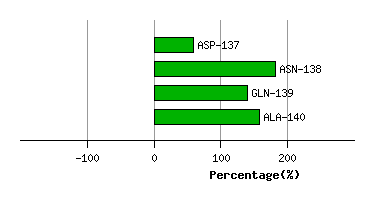
Graph shows rotational transition at bending residues and can be used
to identify hinge bending residues.
Probably only informative for interdomain rotations greater than 20 degrees
Residue
iResidue
i+1Distance of hinge axis to residue i in
(A) Distance of hinge axis to residue i in
(A) Change in
(deg) Change in
(deg) Angle of psi(i) axis to hinge axis
(deg) Angle of psi(i) axis to hinge axis
(deg) Percentage Progress
ASN-142
ALA-143
17.2
17.5
5.0
1.1
43.3
44.2
28.7
ALA-143
VAL-144
17.5
17.6
-4.8
6.3
102.8
102.0
6.1
VAL-144
ALA-145
13.7
13.9
2.7
-7.9
133.8
130.8
30.2
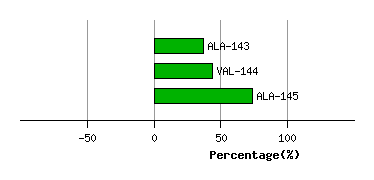
Graph shows rotational transition at bending residues and can be used
to identify hinge bending residues.
Probably only informative for interdomain rotations greater than 20 degrees