Anthranilate Phosphoribosyltransferase
(All numbering and residues are taken from first PDB file)
![]()
![]()
Bending Residue Dihedral Analysis
Residue
iResidue
i+1Distance of hinge axis to residue i in
(A) Distance of hinge axis to residue i in
(A) Change in
(deg) Change in
(deg) Angle of psi(i) axis to hinge axis
(deg) Angle of psi(i) axis to hinge axis
(deg) Percentage Progress
ALA-66
GLY-67
10.9
10.6
7.4
-4.1
24.8
25.7
39.9
GLY-67
ALA-68
11.2
11.0
4.2
-2.4
63.9
59.7
35.3
ALA-68
ALA-69
9.7
9.6
2.9
-0.1
112.8
110.8
6.3
ALA-69
SER-70
6.9
6.8
-5.3
2.5
105.5
107.7
-33.7
SER-70
ALA-71
6.4
6.3
3.5
6.3
25.8
22.1
128.1
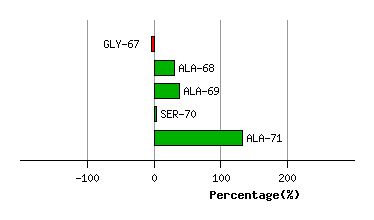
Graph shows rotational transition at bending residues and can be used
to identify hinge bending residues.
Probably only informative for interdomain rotations greater than 20 degrees
Residue
iResidue
i+1Distance of hinge axis to residue i in
(A) Distance of hinge axis to residue i in
(A) Change in
(deg) Change in
(deg) Angle of psi(i) axis to hinge axis
(deg) Angle of psi(i) axis to hinge axis
(deg) Percentage Progress
ALA-74
ASP-75
3.4
3.6
-11.5
11.1
45.2
49.2
17.6
ASP-75
ALA-76
1.2
1.4
3.3
4.8
67.6
63.4
70.5
ALA-76
GLN-77
3.3
3.2
-4.4
1.5
87.9
84.3
13.6
GLN-77
PRO-78
6.9
6.9
-0.3
-0.8
31.0
34.9
47.2
GLN-77
PRO-78
6.9
6.9
-0.3
-0.8
31.0
34.9
47.2
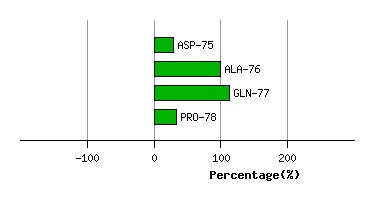
Graph shows rotational transition at bending residues and can be used
to identify hinge bending residues.
Probably only informative for interdomain rotations greater than 20 degrees
Residue
iResidue
i+1Distance of hinge axis to residue i in
(A) Distance of hinge axis to residue i in
(A) Change in
(deg) Change in
(deg) Angle of psi(i) axis to hinge axis
(deg) Angle of psi(i) axis to hinge axis
(deg) Percentage Progress
GLN-77
PRO-78
6.9
6.9
-0.3
-0.8
31.0
34.9
47.2
GLN-77
PRO-78
6.9
6.9
-0.3
-0.8
31.0
34.9
47.2
PRO-78
PHE-79
8.5
8.7
-5.6
3.3
44.0
40.8
48.3
PHE-79
PRO-80
9.7
9.7
0.6
-7.7
127.1
122.5
59.1
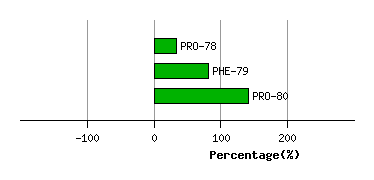
Graph shows rotational transition at bending residues and can be used
to identify hinge bending residues.
Probably only informative for interdomain rotations greater than 20 degrees
Residue
iResidue
i+1Distance of hinge axis to residue i in
(A) Distance of hinge axis to residue i in
(A) Change in
(deg) Change in
(deg) Angle of psi(i) axis to hinge axis
(deg) Angle of psi(i) axis to hinge axis
(deg) Percentage Progress
ALA-118
LYS-119
8.6
8.5
-6.1
4.0
67.1
69.1
-10.9
LYS-119
HIS-120
9.8
9.3
8.9
-11.6
176.6
176.7
25.6
HIS-120
GLY-121
9.3
8.9
10.2
-21.9
101.4
100.4
69.6
GLY-121
ASN-122
11.9
11.3
5.7
6.6
163.0
154.1
-165.8
ASN-122
ARG-123
13.3
13.1
6.0
21.5
92.1
81.9
-15.7
LEU-129
ALA-130
24.6
24.5
141.1
171.1
20.2
56.9
-501.8
ALA-130
GLY-131
23.2
23.4
46.4
5.5
79.2
67.4
210.4
GLY-131
SER-132
19.5
19.6
18.6
-6.2
67.1
67.6
77.4
SER-132
CYS-133
17.4
17.4
1.1
-3.9
125.1
125.8
32.0
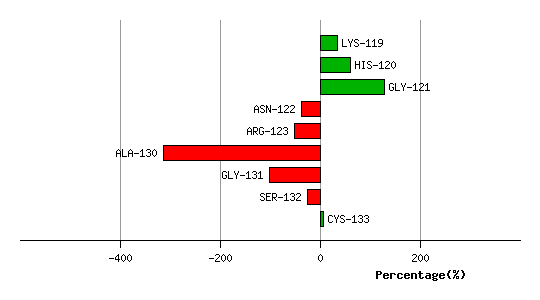
Graph shows rotational transition at bending residues and can be used
to identify hinge bending residues.
Probably only informative for interdomain rotations greater than 20 degrees
Residue
iResidue
i+1Distance of hinge axis to residue i in
(A) Distance of hinge axis to residue i in
(A) Change in
(deg) Change in
(deg) Angle of psi(i) axis to hinge axis
(deg) Angle of psi(i) axis to hinge axis
(deg) Percentage Progress
CYS-160
PHE-161
13.6
13.5
-1.7
0.8
61.9
66.6
17.3
PHE-161
LEU-162
13.2
12.9
-2.8
4.2
21.8
19.5
-14.2
LEU-162
PHE-163
11.1
10.8
-8.3
5.1
58.2
61.0
11.3
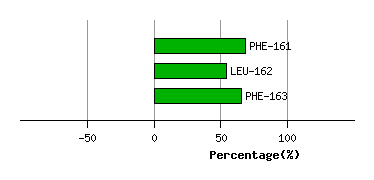
Graph shows rotational transition at bending residues and can be used
to identify hinge bending residues.
Probably only informative for interdomain rotations greater than 20 degrees
Residue
iResidue
i+1Distance of hinge axis to residue i in
(A) Distance of hinge axis to residue i in
(A) Change in
(deg) Change in
(deg) Angle of psi(i) axis to hinge axis
(deg) Angle of psi(i) axis to hinge axis
(deg) Percentage Progress
ASN-188
VAL-189
15.0
15.7
19.4
-30.2
133.4
142.0
98.0
VAL-189
LEU-190
13.3
13.2
16.0
4.0
76.0
76.8
125.1
LEU-190
GLY-191
10.1
10.0
0.0
-5.9
105.9
106.0
68.4
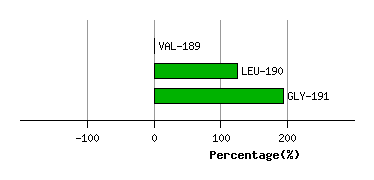
Graph shows rotational transition at bending residues and can be used
to identify hinge bending residues.
Probably only informative for interdomain rotations greater than 20 degrees