Ure2 Protein
(All numbering and residues are taken from first PDB file)
![]()
![]()
Bending Residue Dihedral Analysis
Residue
iResidue
i+1Distance of hinge axis to residue i in
(A) Distance of hinge axis to residue i in
(A) Change in
(deg) Change in
(deg) Angle of psi(i) axis to hinge axis
(deg) Angle of psi(i) axis to hinge axis
(deg) Percentage Progress
ALA-264
GLU-265
6.4
6.1
-7.3
8.0
55.9
57.6
0.1
GLU-265
ARG-266
5.5
4.6
-8.5
12.2
86.8
95.6
2.1
ARG-266
ARG-267
1.9
1.8
-12.7
18.4
148.0
150.1
25.4
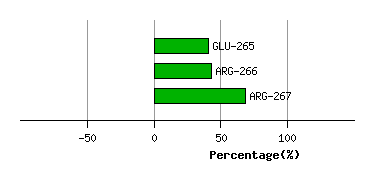
Graph shows rotational transition at bending residues and can be used
to identify hinge bending residues.
Probably only informative for interdomain rotations greater than 20 degrees
Residue
iResidue
i+1Distance of hinge axis to residue i in
(A) Distance of hinge axis to residue i in
(A) Change in
(deg) Change in
(deg) Angle of psi(i) axis to hinge axis
(deg) Angle of psi(i) axis to hinge axis
(deg) Percentage Progress
GLU-268
ALA-269
4.7
3.4
-0.8
9.2
126.4
126.7
18.7
ALA-269
LEU-270
4.2
3.0
-0.4
-1.5
61.3
60.0
4.4
LEU-270
VAL-271
3.9
4.0
-8.8
5.1
44.5
53.8
13.0
VAL-271
MET-272
5.3
5.0
-10.8
19.4
104.3
116.3
12.6
MET-272
GLU-273
8.4
7.5
1.6
-15.6
63.7
67.8
-23.7
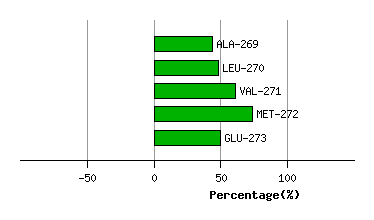
Graph shows rotational transition at bending residues and can be used
to identify hinge bending residues.
Probably only informative for interdomain rotations greater than 20 degrees
Residue
iResidue
i+1Distance of hinge axis to residue i in
(A) Distance of hinge axis to residue i in
(A) Change in
(deg) Change in
(deg) Angle of psi(i) axis to hinge axis
(deg) Angle of psi(i) axis to hinge axis
(deg) Percentage Progress
PHE-294
PHE-295
4.6
5.6
-22.8
4.7
97.4
97.6
-17.3
PHE-295
ASP-296
0.8
1.8
8.4
-5.7
85.4
88.2
-13.2
ASP-296
TYR-297
4.1
4.5
-8.9
7.9
128.3
124.9
-5.0
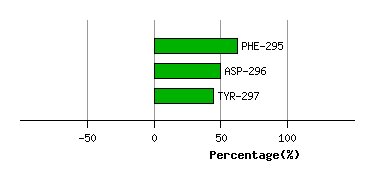
Graph shows rotational transition at bending residues and can be used
to identify hinge bending residues.
Probably only informative for interdomain rotations greater than 20 degrees