Protein Methyltransferase Hemk
(All numbering and residues are taken from first PDB file)
![]()
![]()
Bending Residue Dihedral Analysis
Residue
iResidue
i+1Distance of hinge axis to residue i in
(A) Distance of hinge axis to residue i in
(A) Change in
(deg) Change in
(deg) Angle of psi(i) axis to hinge axis
(deg) Angle of psi(i) axis to hinge axis
(deg) Percentage Progress
GLU-9
ALA-10
15.5
15.4
28.9
-31.7
62.9
63.0
41.3
ALA-10
ILE-11
11.7
11.7
6.0
4.9
24.2
19.5
93.6
ILE-11
SER-12
11.9
12.1
-12.0
4.0
137.1
137.2
-74.6
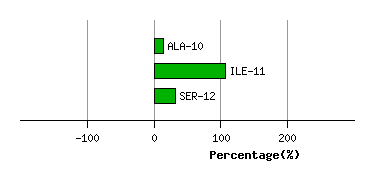
Graph shows rotational transition at bending residues and can be used
to identify hinge bending residues.
Probably only informative for interdomain rotations greater than 20 degrees
Residue
iResidue
i+1Distance of hinge axis to residue i in
(A) Distance of hinge axis to residue i in
(A) Change in
(deg) Change in
(deg) Angle of psi(i) axis to hinge axis
(deg) Angle of psi(i) axis to hinge axis
(deg) Percentage Progress
GLN-13
LEU-14
12.4
11.2
-93.9
70.9
86.6
55.5
37.7
LEU-14
GLN-15
8.9
7.9
-11.7
15.8
32.4
32.1
17.0
GLN-15
ALA-16
9.6
9.9
-34.2
-17.4
55.2
43.7
176.7
ALA-16
SER-17
6.6
7.5
-27.8
38.2
102.7
100.1
90.1
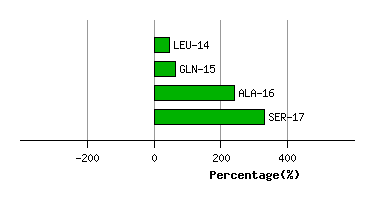
Graph shows rotational transition at bending residues and can be used
to identify hinge bending residues.
Probably only informative for interdomain rotations greater than 20 degrees
Residue
iResidue
i+1Distance of hinge axis to residue i in
(A) Distance of hinge axis to residue i in
(A) Change in
(deg) Change in
(deg) Angle of psi(i) axis to hinge axis
(deg) Angle of psi(i) axis to hinge axis
(deg) Percentage Progress
SER-19
PRO-20
7.9
7.8
45.9
10.5
137.7
163.0
-333.1
PRO-20
ARG-21
8.6
8.9
-15.6
15.8
35.1
32.0
5.5
ARG-21
ARG-22
11.4
11.3
-2.4
1.3
54.0
50.7
35.4
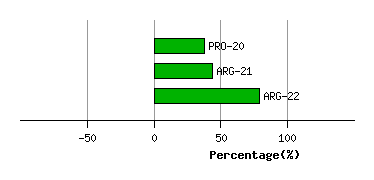
Graph shows rotational transition at bending residues and can be used
to identify hinge bending residues.
Probably only informative for interdomain rotations greater than 20 degrees
Residue
iResidue
i+1Distance of hinge axis to residue i in
(A) Distance of hinge axis to residue i in
(A) Change in
(deg) Change in
(deg) Angle of psi(i) axis to hinge axis
(deg) Angle of psi(i) axis to hinge axis
(deg) Percentage Progress
HIS-30
VAL-31
5.2
6.4
25.5
9.1
40.8
42.4
198.6
VAL-31
THR-32
4.8
5.7
-26.4
-13.8
139.3
149.6
-183.8
THR-32
GLY-33
8.0
8.4
13.5
-62.8
66.8
105.2
178.5
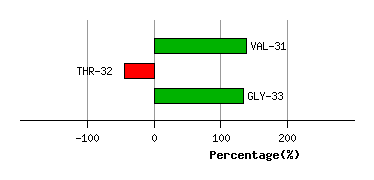
Graph shows rotational transition at bending residues and can be used
to identify hinge bending residues.
Probably only informative for interdomain rotations greater than 20 degrees
Residue
iResidue
i+1Distance of hinge axis to residue i in
(A) Distance of hinge axis to residue i in
(A) Change in
(deg) Change in
(deg) Angle of psi(i) axis to hinge axis
(deg) Angle of psi(i) axis to hinge axis
(deg) Percentage Progress
GLY-65
GLU-66
4.7
4.2
6.5
-0.6
125.8
131.0
-13.3
GLU-66
PRO-67
4.8
4.6
8.9
-11.4
98.4
98.8
22.8
PRO-67
ILE-68
3.6
3.7
-16.7
14.1
30.9
29.8
-2.3
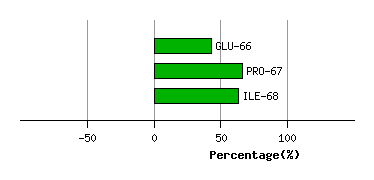
Graph shows rotational transition at bending residues and can be used
to identify hinge bending residues.
Probably only informative for interdomain rotations greater than 20 degrees