Actin Interacting Protein 1
(All numbering and residues are taken from first PDB file)
![]()
![]()
Bending Residue Dihedral Analysis
Residue
iResidue
i+1Distance of hinge axis to residue i in
(A) Distance of hinge axis to residue i in
(A) Change in
(deg) Change in
(deg) Angle of psi(i) axis to hinge axis
(deg) Angle of psi(i) axis to hinge axis
(deg) Percentage Progress
PHE-10
PRO-11
9.0
8.9
1.3
3.1
84.0
85.1
3.2
PRO-11
SER-12
6.6
6.5
-2.8
-5.4
92.2
90.1
-43.3
SER-12
LEU-13
3.3
3.2
0.1
1.4
23.1
22.0
18.7
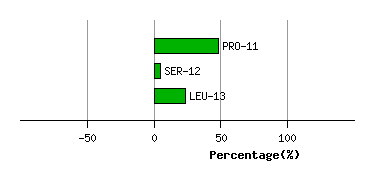
Graph shows rotational transition at bending residues and can be used
to identify hinge bending residues.
Probably only informative for interdomain rotations greater than 20 degrees
Residue
iResidue
i+1Distance of hinge axis to residue i in
(A) Distance of hinge axis to residue i in
(A) Change in
(deg) Change in
(deg) Angle of psi(i) axis to hinge axis
(deg) Angle of psi(i) axis to hinge axis
(deg) Percentage Progress
ILE-327
THR-328
0.6
0.6
-1.0
-0.8
167.9
167.4
-42.6
THR-328
ALA-329
1.0
1.3
5.2
-6.2
52.3
50.0
-9.1
ALA-329
LEU-330
2.9
2.9
-1.1
-7.1
58.7
59.6
74.5
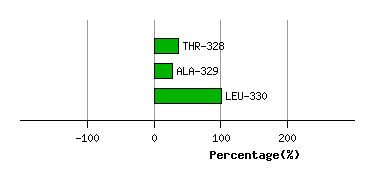
Graph shows rotational transition at bending residues and can be used
to identify hinge bending residues.
Probably only informative for interdomain rotations greater than 20 degrees
Residue
iResidue
i+1Distance of hinge axis to residue i in
(A) Distance of hinge axis to residue i in
(A) Change in
(deg) Change in
(deg) Angle of psi(i) axis to hinge axis
(deg) Angle of psi(i) axis to hinge axis
(deg) Percentage Progress
SER-358
ASN-359
11.3
11.4
2.2
5.9
80.3
77.4
-3.5
ASN-359
ARG-360
12.4
12.5
2.2
-2.5
121.2
120.1
39.1
ARG-360
VAL-361
11.0
11.2
-2.8
3.9
63.5
63.8
45.5
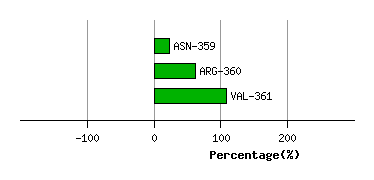
Graph shows rotational transition at bending residues and can be used
to identify hinge bending residues.
Probably only informative for interdomain rotations greater than 20 degrees
Residue
iResidue
i+1Distance of hinge axis to residue i in
(A) Distance of hinge axis to residue i in
(A) Change in
(deg) Change in
(deg) Angle of psi(i) axis to hinge axis
(deg) Angle of psi(i) axis to hinge axis
(deg) Percentage Progress
ALA-367
THR-368
14.3
14.3
8.9
-10.5
75.3
74.3
-67.7
THR-368
MET-369
12.3
12.1
-13.5
23.8
119.9
121.7
460.2
MET-369
ILE-370
9.3
9.0
-21.1
4.8
130.8
128.8
-524.7
ILE-370
THR-371
7.5
7.4
2.8
-0.3
57.4
56.4
34.5
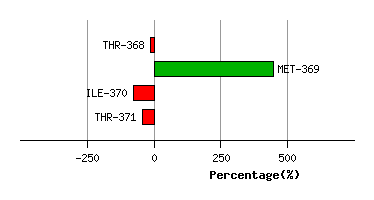
Graph shows rotational transition at bending residues and can be used
to identify hinge bending residues.
Probably only informative for interdomain rotations greater than 20 degrees
Residue
iResidue
i+1Distance of hinge axis to residue i in
(A) Distance of hinge axis to residue i in
(A) Change in
(deg) Change in
(deg) Angle of psi(i) axis to hinge axis
(deg) Angle of psi(i) axis to hinge axis
(deg) Percentage Progress
GLY-372
ILE-373
5.5
5.7
-9.0
3.6
67.0
63.2
46.9
ILE-373
LYS-374
8.2
8.3
-1.4
-2.7
112.6
112.6
-22.7
LYS-374
THR-375
10.6
10.9
-6.7
-4.9
72.9
71.0
63.9
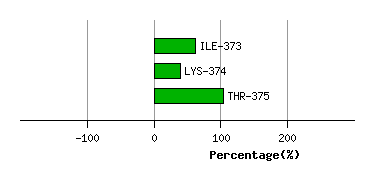
Graph shows rotational transition at bending residues and can be used
to identify hinge bending residues.
Probably only informative for interdomain rotations greater than 20 degrees
Residue
iResidue
i+1Distance of hinge axis to residue i in
(A) Distance of hinge axis to residue i in
(A) Change in
(deg) Change in
(deg) Angle of psi(i) axis to hinge axis
(deg) Angle of psi(i) axis to hinge axis
(deg) Percentage Progress
GLY-379
ASP-380
19.9
20.3
-12.9
21.1
90.7
84.2
-68.5
ASP-380
LEU-381
18.3
18.7
-12.5
9.4
89.7
96.2
-7.1
LEU-381
PHE-382
14.6
15.1
-9.6
1.5
60.8
56.6
57.2
PHE-382
THR-383
13.2
13.4
-10.5
3.6
110.8
108.7
-98.4
THR-383
VAL-384
11.0
11.2
0.6
-3.2
120.4
121.8
53.4
VAL-384
SER-385
10.2
10.4
-5.5
1.0
128.8
127.5
-55.5
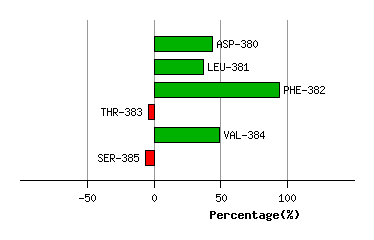
Graph shows rotational transition at bending residues and can be used
to identify hinge bending residues.
Probably only informative for interdomain rotations greater than 20 degrees
Residue
iResidue
i+1Distance of hinge axis to residue i in
(A) Distance of hinge axis to residue i in
(A) Change in
(deg) Change in
(deg) Angle of psi(i) axis to hinge axis
(deg) Angle of psi(i) axis to hinge axis
(deg) Percentage Progress
ALA-578
HIS-579
14.7
14.6
4.7
-2.2
50.3
50.8
57.9
HIS-579
ALA-580
12.0
11.9
-9.9
5.7
101.3
101.1
-33.8
ALA-580
MET-581
14.2
14.3
-0.3
-0.2
86.6
89.6
16.6
MET-581
SER-582
14.6
14.5
5.5
-8.0
111.4
109.4
35.2
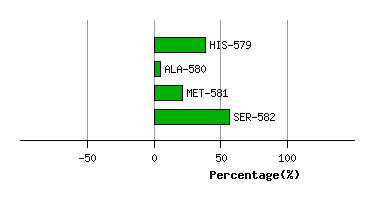
Graph shows rotational transition at bending residues and can be used
to identify hinge bending residues.
Probably only informative for interdomain rotations greater than 20 degrees